Page 228 - 2018 Comprehensive Annual Financial Report - City of Winston-Salem
P. 228

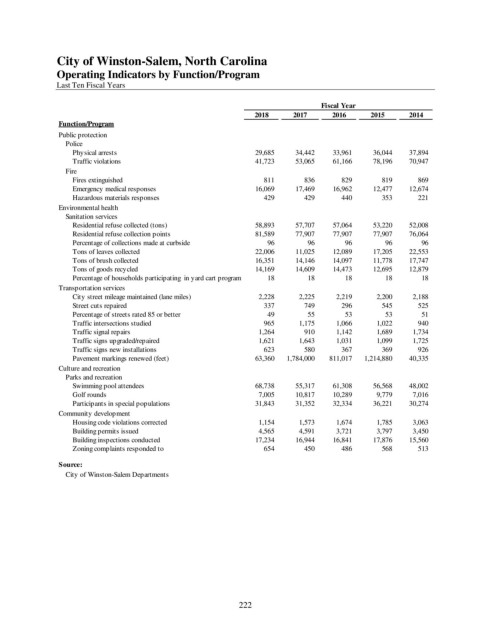
City of Winston-Salem, North Carolina
               Operating Indicators by Function/Program

               Last Ten Fiscal Years

                                                                                   Fiscal Year
                                                                  2018      2017      2016      2015     2014
                Function/Program
                Public protection
                  Police
                   Physical arrests                                   29,685         34,442        33,961         36,044       37,894
                   Traffic violations                                 41,723         53,065        61,166         78,196       70,947
                  Fire
                   Fires extinguished                                      811              836             829              819            869
                   Emergency medical responses                        16,069         17,469        16,962         12,477       12,674
                   Hazardous materials responses                           429              429             440              353            221
                Environmental health
                  Sanitation services
                   Residential refuse collected (tons)                58,893         57,707        57,064         53,220       52,008
                   Residential refuse collection points               81,589         77,907        77,907         77,907       76,064
                   Percentage of collections made at curbside                96                96               96                96              96
                   Tons of leaves collected                           22,006         11,025        12,089         17,205       22,553
                   Tons of brush collected                            16,351         14,146        14,097         11,778       17,747
                   Tons of goods recycled                             14,169         14,609        14,473         12,695       12,879
                   Percentage of households participating  in yard cart program              18                18               18                18              18
                Transportation services
                   City street mileage maintained (lane miles)          2,228           2,225          2,219           2,200         2,188
                   Street cuts repaired                                    337              749             296              545            525
                   Percentage of streets rated 85 or better                  49                55               53                53              51
                   Traffic intersections studied                           965           1,175          1,066           1,022            940
                   Traffic signal repairs                               1,264              910          1,142           1,689         1,734
                   Traffic signs upgraded/repaired                      1,621           1,643          1,031           1,099         1,725
                   Traffic signs new installations                         623              580             367              369            926
                   Pavement markings renewed (feet)                   63,360    1,784,000      811,017    1,214,880       40,335
                Culture and recreation
                  Parks and recreation
                   Swimming pool attendees                            68,738         55,317        61,308         56,568       48,002
                   Golf rounds                                          7,005         10,817        10,289           9,779         7,016
                   Participants in special populations                31,843         31,352        32,334         36,221       30,274
                Community development
                   Housing code violations corrected                    1,154           1,573          1,674           1,785         3,063
                   Building permits issued                              4,565           4,591          3,721           3,797         3,450
                   Building inspections conducted                     17,234         16,944        16,841         17,876       15,560
                   Zoning complaints responded to                          654              450             486              568            513
                Source:
                  City of Winston-Salem Departments


                                                              222
   223   224   225   226   227   228   229   230   231   232   233