
Page 230 - 2018 Comprehensive Annual Financial Report - City of Winston-Salem
P. 230
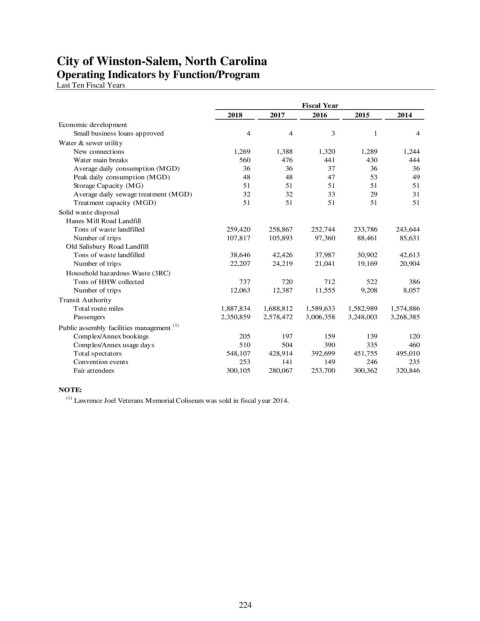
City of Winston-Salem, North Carolina
               Operating Indicators by Function/Program

               Last Ten Fiscal Years

                                                                              Fiscal Year
                                                           2018       2017       2016       2015      2014
                Economic development
                    Small business loans approved                        4                  4                  3                  1                  4
                Water & sewer utility
                    New connections                               1,269           1,388           1,320           1,289           1,244
                    Water main breaks                                560              476              441              430              444
                    Average daily consumption (MGD)                    36                36                37                36                36
                    Peak daily consumption (MGD)                       48                48                47                53                49
                    Storage Capacity (MG)                              51                51                51                51                51
                    Average daily sewage treatment (MGD)                32                32                33                29                31
                    Treatment capacity (MGD)                           51                51                51                51                51
                Solid waste disposal
                  Hanes Mill Road Landfill
                    Tons of waste landfilled                  259,420       258,867       252,744       233,786       243,644
                    Number of trips                           107,817       105,893         97,360         88,461         85,631
                  Old Salisbury Road Landfill
                    Tons of waste landfilled                    38,646         42,426         37,987         30,902         42,613
                    Number of trips                             22,207         24,219         21,041         19,169         20,904
                  Household hazardous Waste (3RC)
                    Tons of HHW collected                            737              720              712              522              386
                    Number of trips                             12,063         12,387         11,555           9,208           8,057
                Transit Authority
                    Total route miles                      1,887,834    1,688,812    1,589,633    1,582,989    1,574,886
                    Passengers                             2,350,859    2,578,472    3,006,358    3,248,003    3,268,385
                Public assembly facilities management  (1)
                    Complex/Annex bookings                           205              197              159              139              120
                    Complex/Annex usage days                         510              504              390              335              460
                    Total spectators                          548,107       428,914       392,699       451,755       495,010
                    Convention events                                253              141              149              246              235
                    Fair attendees                            300,105       280,067       253,700       300,362       320,846

                NOTE:
                  (1)  Lawrence Joel Veterans Memorial Coliseum was sold in fiscal year 2014.


                                                              224