
Page 231 - 2018 Comprehensive Annual Financial Report - City of Winston-Salem
P. 231
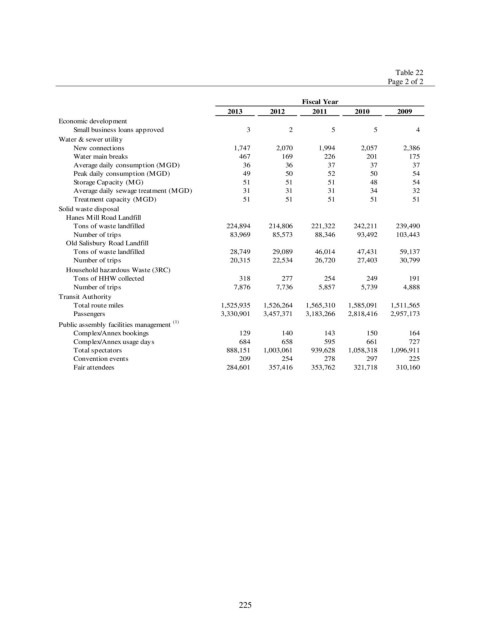
Table 22
                                                                                                    Page 2 of 2

                                                                              Fiscal Year
                                                           2013       2012       2011       2010      2009
                Economic development
                    Small business loans approved                        3                  2                  5                  5                  4
                Water & sewer utility
                    New connections                               1,747           2,070           1,994           2,057           2,386
                    Water main breaks                                467              169              226              201              175
                    Average daily consumption (MGD)                    36                36                37                37                37
                    Peak daily consumption (MGD)                       49                50                52                50                54
                    Storage Capacity (MG)                              51                51                51                48                54
                    Average daily sewage treatment (MGD)                31                31                31                34                32
                    Treatment capacity (MGD)                           51                51                51                51                51
                Solid waste disposal
                  Hanes Mill Road Landfill
                    Tons of waste landfilled                  224,894       214,806       221,322       242,211       239,490
                    Number of trips                             83,969         85,573         88,346         93,492       103,443
                  Old Salisbury Road Landfill
                    Tons of waste landfilled                    28,749         29,089         46,014         47,431         59,137
                    Number of trips                             20,315         22,534         26,720         27,403         30,799
                  Household hazardous Waste (3RC)
                    Tons of HHW collected                            318              277              254              249              191
                    Number of trips                               7,876           7,736           5,857           5,739           4,888
                Transit Authority
                    Total route miles                      1,525,935    1,526,264    1,565,310    1,585,091    1,511,565
                    Passengers                             3,330,901    3,457,371    3,183,266    2,818,416    2,957,173
                Public assembly facilities management  (1)
                    Complex/Annex bookings                           129              140              143              150              164
                    Complex/Annex usage days                         684              658              595              661              727
                    Total spectators                          888,151    1,003,061       939,628    1,058,318    1,096,911
                    Convention events                                209              254              278              297              225
                    Fair attendees                            284,601       357,416       353,762       321,718       310,160


                                                              225