
Page 229 - 2018 Comprehensive Annual Financial Report - City of Winston-Salem
P. 229
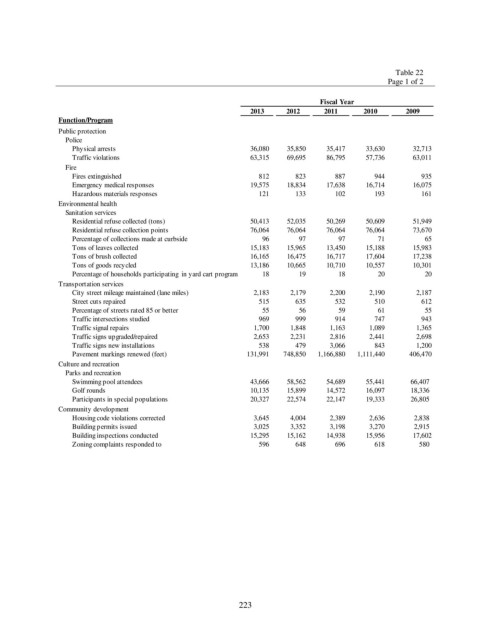
Table 22
                                                                                                    Page 1 of 2

                                                                                   Fiscal Year
                                                                 2013     2012      2011      2010       2009
                Function/Program
                Public protection
                  Police
                   Physical arrests                                 36,080        35,850         35,417         33,630  32,713
                   Traffic violations                               63,315        69,695         86,795         57,736  63,011
                  Fire
                   Fires extinguished                                    812             823              887              944  935
                   Emergency medical responses                      19,575        18,834         17,638         16,714  16,075
                   Hazardous materials responses                         121             133              102              193  161
                Environmental health
                  Sanitation services
                   Residential refuse collected (tons)              50,413        52,035         50,269         50,609  51,949
                   Residential refuse collection points             76,064        76,064         76,064         76,064  73,670
                   Percentage of collections made at curbside              96               97                97                71  65
                   Tons of leaves collected                         15,183        15,965         13,450         15,188  15,983
                   Tons of brush collected                          16,165        16,475         16,717         17,604  17,238
                   Tons of goods recycled                           13,186        10,665         10,710         10,557  10,301
                   Percentage of households participating  in yard cart program             18               19                18                20  20
                Transportation services
                   City street mileage maintained (lane miles)         2,183          2,179           2,200           2,190  2,187
                   Street cuts repaired                                  515             635              532              510  612
                   Percentage of streets rated 85 or better                55               56                59                61  55
                   Traffic intersections studied                         969             999              914              747  943
                   Traffic signal repairs                             1,700          1,848           1,163           1,089  1,365
                   Traffic signs upgraded/repaired                    2,653          2,231           2,816           2,441  2,698
                   Traffic signs new installations                       538             479           3,066              843  1,200
                   Pavement markings renewed (feet)               131,991      748,850    1,166,880    1,111,440  406,470
                Culture and recreation
                  Parks and recreation
                   Swimming pool attendees                          43,666        58,562         54,689         55,441            66,407
                   Golf rounds                                      10,135        15,899         14,572         16,097            18,336
                   Participants in special populations              20,327        22,574         22,147         19,333            26,805
                Community development
                   Housing code violations corrected                  3,645          4,004           2,389           2,636              2,838
                   Building permits issued                            3,025          3,352           3,198           3,270              2,915
                   Building inspections conducted                   15,295        15,162         14,938         15,956  17,602
                   Zoning complaints responded to                        596             648              696              618                 580


                                                              223