
Page 47 - 2018 Comprehensive Annual Financial Report - City of Winston-Salem
P. 47
Notes to the Financial Statements
The next section of the basic nancial statements is the notes to the nancial statements, which adds detailed explanations of
some of the data contained in the statements. The notes may provide a better understanding of the information presented in the
government-wide and fund nancial statements.
Government-wide Financial Analysis
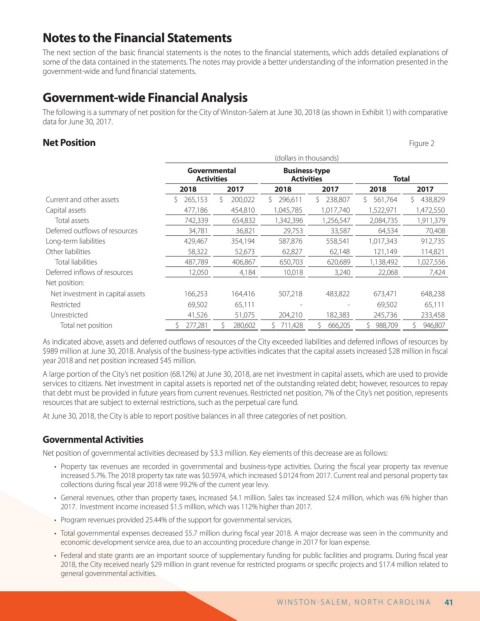
The following is a summary of net position for the City of Winston-Salem at June 30, 2018 (as shown in Exhibit 1) with comparative
data for June 30, 2017.
Net Position Figure 2
(dollars in thousands)
Governmental Business-type
Activities Activities Total
2018 2017 2018 2017 2018 2017
Current and other assets $ 265,153 $ 200,022 $ 296,611 $ 238,807 $ 561,764 $ 438,829
Capital assets 477,186 454,810 1,045,785 1,017,740 1,522,971 1,472,550
Total assets 742,339 654,832 1,342,396 1,256,547 2,084,735 1,911,379
Deferred out ows of resources 34,781 36,821 29,753 33,587 64,534 70,408
Long-term liabilities 429,467 354,194 587,876 558,541 1,017,343 912,735
Other liabilities 58,322 52,673 62,827 62,148 121,149 114,821
Total liabilities 487,789 406,867 650,703 620,689 1,138,492 1,027,556
Deferred in ows of resources 12,050 4,184 10,018 3,240 22,068 7,424
Net position:
Net investment in capital assets 166,253 164,416 507,218 483,822 673,471 648,238
Restricted 69,502 65,111 - - 69,502 65,111
Unrestricted 41,526 51,075 204,210 182,383 245,736 233,458
Total net position $ 277,281 $ 280,602 $ 711,428 $ 666,205 $ 988,709 $ 946,807
As indicated above, assets and deferred out ows of resources of the City exceeded liabilities and deferred in ows of resources by
$989 million at June 30, 2018. Analysis of the business-type activities indicates that the capital assets increased $28 million in scal
year 2018 and net position increased $45 million.
A large portion of the City’s net position (68.12%) at June 30, 2018, are net investment in capital assets, which are used to provide
services to citizens. Net investment in capital assets is reported net of the outstanding related debt; however, resources to repay
that debt must be provided in future years from current revenues. Restricted net position, 7% of the City’s net position, represents
resources that are subject to external restrictions, such as the perpetual care fund.
At June 30, 2018, the City is able to report positive balances in all three categories of net position.
Governmental Activities
Net position of governmental activities decreased by $3.3 million. Key elements of this decrease are as follows:
• Property tax revenues are recorded in governmental and business-type activities. During the scal year property tax revenue
increased 5.7%. The 2018 property tax rate was $0.5974, which increased $.0124 from 2017. Current real and personal property tax
collections during scal year 2018 were 99.2% of the current year levy.
• General revenues, other than property taxes, increased $4.1 million. Sales tax increased $2.4 million, which was 6% higher than
2017. Investment income increased $1.5 million, which was 112% higher than 2017.
• Program revenues provided 25.44% of the support for governmental services.
• Total governmental expenses decreased $5.7 million during scal year 2018. A major decrease was seen in the community and
economic development service area, due to an accounting procedure change in 2017 for loan expense.
• Federal and state grants are an important source of supplementary funding for public facilities and programs. During scal year
2018, the City received nearly $29 million in grant revenue for restricted programs or speci c projects and $17.4 million related to
general governmental activities.
W I N S T O N S AL E M , N O R T H C AR O L I N A 41