Page 49 - 2018 Comprehensive Annual Financial Report - City of Winston-Salem
P. 49

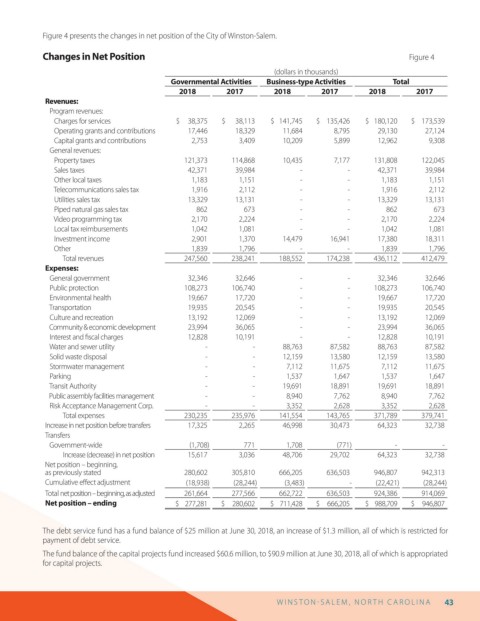
Figure 4 presents the changes in net position of the City of Winston-Salem.


                 Changes in Net Position                                                                       Figure 4
                                                                             (dollars in thousands)
                                                  Governmental Activities  Business-type Activities        Total
                                                    2018        2017         2018        2017        2018        2017
                  Revenues:
                     Program revenues:
                        Charges for services        $     38,375    $      38,113    $   141,745    $    135,426    $   180,120    $    173,539
                        Operating grants and contributions   17,446    18,329    11,684     8,795       29,130      27,124
                        Capital grants and contributions   2,753    3,409      10,209       5,899       12,962       9,308
                     General revenues:
                        Property taxes                121,373     114,868      10,435       7,177      131,808     122,045
                        Sales taxes                    42,371      39,984           -           -       42,371      39,984
                        Other local taxes               1,183       1,151           -           -        1,183       1,151
                        Telecommunications sales tax    1,916       2,112           -           -        1,916       2,112
                        Utilities sales tax            13,329      13,131           -           -       13,329      13,131
                        Piped natural gas sales tax      862         673            -           -         862         673
                        Video programming tax           2,170       2,224           -           -        2,170       2,224
                        Local tax reimbursements        1,042       1,081           -           -        1,042       1,081
                        Investment income               2,901       1,370      14,479       16,941      17,380      18,311
                        Other                           1,839       1,796           -           -        1,839       1,796
                              Total revenues          247,560     238,241     188,552      174,238     436,112     412,479
                  Expenses:
                     General government                32,346      32,646           -           -       32,346      32,646
                     Public protection                108,273     106,740           -           -      108,273     106,740
                     Environmental health              19,667      17,720           -           -       19,667      17,720
                     Transportation                    19,935      20,545           -           -       19,935      20,545
                     Culture and recreation            13,192      12,069           -           -       13,192      12,069
                     Community & economic development   23,994     36,065           -           -       23,994      36,065
                     Interest and  scal charges        12,828      10,191           -           -       12,828      10,191
                     Water and sewer utility                -           -      88,763       87,582      88,763      87,582
                     Solid waste disposal                   -           -      12,159       13,580      12,159      13,580
                     Stormwater management                  -           -       7,112       11,675       7,112      11,675
                     Parking                                -           -       1,537       1,647        1,537       1,647
                     Transit Authority                      -           -      19,691       18,891      19,691      18,891
                     Public assembly facilities management   -          -       8,940       7,762        8,940       7,762
                     Risk Acceptance Management Corp.       -           -       3,352       2,628        3,352       2,628
                              Total expenses          230,235     235,976     141,554      143,765     371,789     379,741
                  Increase in net position before transfers   17,325    2,265    46,998    30,473       64,323      32,738
                  Transfers
                     Government-wide                    (1,708)      771        1,708        (771)          -           -
                              Increase (decrease) in net position   15,617    3,036    48,706    29,702    64,323    32,738
                  Net position – beginning,
                  as previously stated                280,602     305,810     666,205      636,503     946,807     942,313
                  Cumulative e ect adjustment          (18,938)    (28,244)     (3,483)         -      (22,421)    (28,244)
                  Total net position – beginning, as adjusted   261,664    277,566    662,722    636,503    924,386    914,069
                  Net position – ending             $    277,281    $     280,602    $    711,428    $     666,205    $    988,709    $     946,807


                 The debt service fund has a fund balance of $25 million at June 30, 2018, an increase of $1.3 million, all of which is restricted for
                 payment of debt service.
                 The fund balance of the capital projects fund increased $60.6 million, to $90.9 million at June 30, 2018, all of which is appropriated
                 for capital projects.


                                                                             W I N S T O N   S AL E M ,  N O R T H  C AR O L I N A  43
   44   45   46   47   48   49   50   51   52   53   54