
Page 50 - 2018 Comprehensive Annual Financial Report - City of Winston-Salem
P. 50
General Fund Budgetary Highlights. Di erences between the original budget and the nal amended budget resulted in
appropriations increasing $3.8 million during scal year 2018. Expenditure budgets were increased $2.1 million for carry
over encumbrances. Major budget amendments included an additional $400 thousand for City street maintenance,
$100,000 for capital projects at Smith Reynolds Airport a community and economic development project, $442 thousand
to the public safety area to fund personnel, equipment and training, and a transfer to the grants fund for a local match for
the re department, $789 thousand to the public safety area for police and re pay adjustments.
General fund revenues recognized positive budget variances during 2017-2018. The City’s general fund budget had a
favorable expenditure variance of $4.4 million.
Proprietary Funds. The City’s proprietary fund nancial statements provide the same type of information as that provided
in the government-wide nancial statements, but in more detail. The major enterprise funds are the water and sewer
utility, solid waste disposal and Transit Authority funds.
Net position of the water and sewer utility, solid waste disposal and Transit Authority funds were $500 million, $48 million
and $29 million at June 30, 2018, respectively. The net position of the water and sewer fund increased $37.9 million
primarily due to charges for services and capital contributions. The water and sewer fund adopted a 4% increase in the
water volumetric rate, a 6% increase in the sewer volumetric rate, and a $1.64/month increase for water and sewer base
charges for residential customers in October 2017.
Capital Asset and Debt Administration
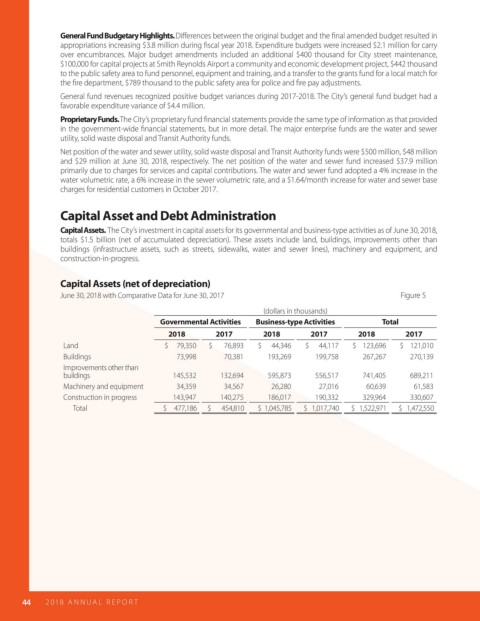
Capital Assets. The City’s investment in capital assets for its governmental and business-type activities as of June 30, 2018,
totals $1.5 billion (net of accumulated depreciation). These assets include land, buildings, improvements other than
buildings (infrastructure assets, such as streets, sidewalks, water and sewer lines), machinery and equipment, and
construction-in-progress.
Capital Assets (net of depreciation)
June 30, 2018 with Comparative Data for June 30, 2017 Figure 5
(dollars in thousands)
Governmental Activities Business-type Activities Total
2018 2017 2018 2017 2018 2017
Land $ 79,350 $ 76,893 $ 44,346 $ 44,117 $ 123,696 $ 121,010
Buildings 73,998 70,381 193,269 199,758 267,267 270,139
Improvements other than
buildings 145,532 132,694 595,873 556,517 741,405 689,211
Machinery and equipment 34,359 34,567 26,280 27,016 60,639 61,583
Construction in progress 143,947 140,275 186,017 190,332 329,964 330,607
Total $ 477,186 $ 454,810 $ 1,045,785 $ 1,017,740 $ 1,522,971 $ 1,472,550
44 2018 AN NUAL R E P O R T