
Page 214 - Physics Form 5 KSSM_Neat
P. 214
5. Repeat step 4 for 20 times. SCAN ME
SCAN ME
6. Scan the QR code and print Table 6.1. Worksheet
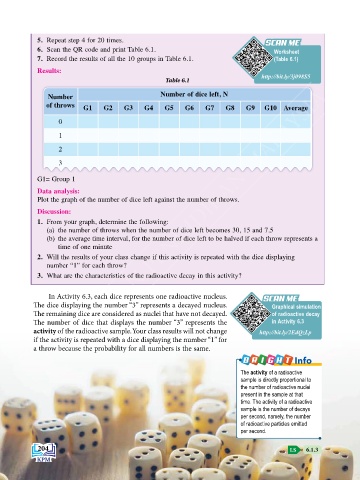
7. Record the results of all the 10 groups in Table 6.1. (Table 6.1)
Results:
Table 6.1 http://bit.ly/3j098S5
KEMENTERIAN PENDIDIKAN MALAYSIA
Number Number of dice left, N
of throws G1 G2 G3 G4 G5 G6 G7 G8 G9 G10 Average
0
1
2
3
G1= Group 1
Data analysis:
Plot the graph of the number of dice left against the number of throws.
Discussion:
1. From your graph, determine the following:
(a) the number of throws when the number of dice left becomes 30, 15 and 7.5
(b) the average time interval, for the number of dice left to be halved if each throw represents a
time of one minute
2. Will the results of your class change if this activity is repeated with the dice displaying
number “1” for each throw?
3. What are the characteristics of the radioactive decay in this activity?
In Activity 6.3, each dice represents one radioactive nucleus. SCAN ME
SCAN ME
The dice displaying the number “3” represents a decayed nucleus. Graphical simulation
The remaining dice are considered as nuclei that have not decayed. of radioactive decay
The number of dice that displays the number “3” represents the in Activity 6.3
activity of the radioactive sample. Your class results will not change http://bit.ly/2EdQzLp
if the activity is repeated with a dice displaying the number “1” for
a throw because the probability for all numbers is the same.
Info
The activity of a radioactive
sample is directly proportional to
the number of radioactive nuclei
present in the sample at that
time. The activity of a radioactive
sample is the number of decays
per second, namely, the number
of radioactive particles emitted
per second.
204 LS 6.1.3