
Page 215 - Physics Form 5 KSSM_Neat
P. 215
The concept of half-life can also be expressed in the form of a decay series as follow: CHAPTER 6
N
N
N
1
N ˜ ( ) ˜ ( ) ˜ ( ) ˜ … ˜ ( ) n N
0
0
0
0 T 1 2 T 1 4 T 1 8 T 1 T 1 2 0 Nuclear Physics
2 2 2 2 2
1
Number of radioactive nuclei that has not decayed, N = ( ) n N 0
2
KEMENTERIAN PENDIDIKAN MALAYSIA
where N = the initial number of radioactive nuclei
0
n = number of half-life (limited to positive integers)
T 1 = half-life of radioactive substances
2
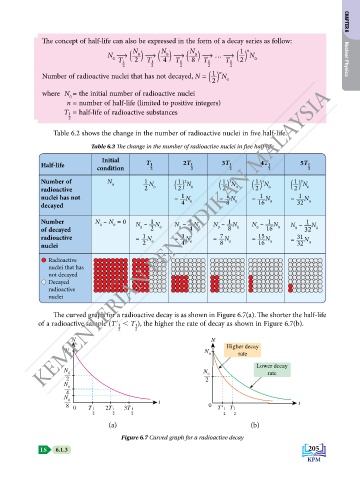
Table 6.2 shows the change in the number of radioactive nuclei in five half-life.
Table 6.2 The change in the number of radioactive nuclei in five half-life
Initial
Half-life condition T 1 2 2T 1 2 3T 1 2 4T 1 2 5T 1 2
Number of N 0 1 N ( ) N ( ) N ( ) N ( ) N
1 2
1 5
1 3
1 4
radioactive 2 0 2 0 2 0 2 0 2 0
1
1
nuclei has not = N = N = 1 N = 1 N
decayed 4 0 8 0 16 0 32 0
1
1
1
Number N – N = 0 N – N N – N N – N N – 1 N N – 1 N
0
0
of decayed 0 2 0 0 4 0 0 8 0 0 16 0 0 32 0
7
1
3
radioactive = N 0 = N 0 = N 0 = 15 N 0 = 31 N
nuclei 2 4 8 16 32 0
Radioactive
nuclei that has
not decayed
Decayed
radioactive
nuclei
The curved graph for a radioactive decay is as shown in Figure 6.7(a). The shorter the half-life
of a radioactive sample (Tʹ 1 , T 1), the higher the rate of decay as shown in Figure 6.7(b).
2 2
N N
Higher decay
N N
0 0 rate
Lower decay
N N
–– 0 –– 0 rate
2 2
N
–– 0
4
N
–– 0 t t
8 0 T 2T 3T 0 T 1 ' T
– 1 1 – 1 – – 1 –
2 2 2 2 2
(a) (b)
Figure 6.7 Curved graph for a radioactive decay
LS 6.1.3 205