
Page 240 - Hall et al (2015) Principles of Critical Care-McGraw-Hill
P. 240
144 PART 2: General Management of the Patient
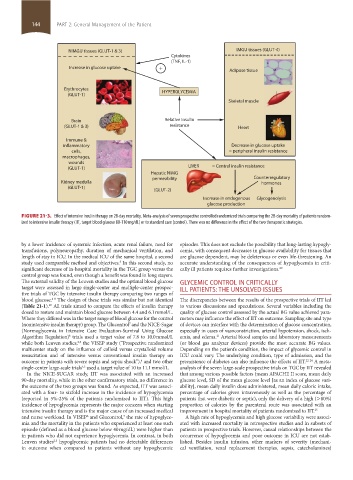
NIMGU tissues (GLUT-1 & 3) IMGU tissues (GLUT-4)
Cytokines
(TNF, IL-1)
Increase in glucose uptake + Adipose tissue
Erythrocytes HYPERGLYCEMIA
(GLUT-1)
Skeletal muscle
Brain Relative insulin
(GLUT-1 & 3) resistance Heart
Immune &
in ammatory Decrease in glucose uptake
cells, = peripheral insulin resistance
macrophages,
wounds
(GLUT-1) LIVER = Central insulin resistance
Hepatic NIMG
permeability Counterregulatory
Kidney medulla hormones
(GLUT-1) (GLUT-2)
Increase in endogenous Glycogenolysis
glucose production
FIGURE 21-3. Effect of intensive insulin therapy on 28-day mortality. Meta-analysis of seven prospective controlled randomized trials comparing the 28-day mortality of patients random-
ized to intensive insulin therapy (IIT, target blood glucose 80-110 mg/dL) or to standard care (control). There was no difference in the effect of the two therapeutic strategies.
by a lower incidence of systemic infection, acute renal failure, need for episodes. This does not exclude the possibility that long-lasting hypogly-
transfusions, polyneuropathy, duration of mechanical ventilation, and cemia, with consequent decreases in glucose availability for tissues that
length of stay in ICU. In the medical ICU of the same hospital, a second are glucose dependent, may be deleterious or even life-threatening. An
study used comparable method and objectives. In this second study, no accurate understanding of the consequences of hypoglycemia in criti-
3
significant decrease of in-hospital mortality in the TGC group versus the cally ill patients requires further investigations. 20
control group was found, even though a benefit was found in long stayers.
The external validity of the Leuven studies and the optimal blood glucose GLYCEMIC CONTROL IN CRITICALLY
target were assessed in large single-center and multiple-center prospec- ILL PATIENTS: THE UNSOLVED ISSUES
tive trials of TGC by intensive insulin therapy comparing two ranges of
blood glucose. The design of these trials was similar but not identical The discrepancies between the results of the prospective trials of IIT led
4-8
(Table 21-1). All trials aimed to compare the effects of insulin therapy to various discussions and speculations. Several variables including the
19
dosed to restore and maintain blood glucose between 4.4 and 6.1 mmol/L. quality of glucose control assessed by the actual BG value achieved para-
Where they differed was in the target range of blood glucose for the control meters may influence the effect of IIT on outcome. Sampling site and type
(nonintensive insulin therapy) group. The Glucontrol and the NICE-Sugar of devices can interfere with the determination of glucose concentration,
7
(Normoglycemia in Intensive Care Evaluation-Survival Using Glucose especially in cases of vasoconstriction, arterial hypotension, shock, isch-
21
8
Algorithm Regulation) trials used a target value of 7.8 to 10.0 mmol/L emia, and edema. Arterial blood samples and laboratory measurements
while both Leuven studies, the VISEP study (“Prospective randomized (or blood gas analyzer devices) provide the most accurate BG values.
2,3
multicenter study on the influence of colloid versus crystalloid volume Depending on the patient’s condition, the impact of glycemic control in
resuscitation and of intensive versus conventional insulin therapy on ICU could vary. The underlying condition, type of admission, and the
6
outcome in patients with severe sepsis and septic shock”), and two other preexistence of diabetes can also influence the effects of IIT. 22-24 A meta-
single-center large-scale trials used a target value of 10 to 11.1 mmol/L. analysis of the seven large-scale prospective trials on TGC by IIT revealed
4,5
In the NICE-SUGAR study, IIT was associated with an increased that among various possible factors (mean APACHE II score, mean daily
90-day mortality, while in the other confirmatory trials, no difference in glucose level, SD of the mean glucose level [as an index of glucose vari-
the outcome of the two groups was found. As expected, IIT was associ- ability], mean daily insulin dose administered, mean daily caloric intake,
ated with a four- to sixfold increase in the incidence of hypoglycemia percentage of calories given intravenously as well as the percentage of
(reported in 5%-25% of the patients randomized to IIT). This high patients that were diabetic or septic), only the delivery of a high (>80%)
incidence of hypoglycemia represents the major concern when starting proportion of calories by the parenteral route was associated with an
intensive insulin therapy and is the major cause of an increased medical improvement in hospital mortality of patients randomized to IIT. 25
and nurse workload. In VISEP and Glucontrol, the rate of hypoglyce- A high rate of hypoglycemia and high glucose variability were associ-
7
6
mia and the mortality in the patients who experienced at least one such ated with increased mortality in retrospective studies and in subsets of
episode (defined as a blood glucose below 40 mg/dL) were higher than patients in prospective trials. However, causal relationships between the
in patients who did not experience hypoglycemia. In contrast, in both occurrence of hypoglycemia and poor outcome in ICU are not estab-
Leuven studies hypoglycemic patients had no detectable differences lished. Besides insulin infusion, other markers of severity (mechani-
2,3
in outcome when compared to patients without any hypoglycemic cal ventilation, renal replacement therapies, sepsis, catecholamines)
section02.indd 144 1/13/2015 2:05:02 PM