
Page 239 - Hall et al (2015) Principles of Critical Care-McGraw-Hill
P. 239
CHAPTER 21: Glycemic Control 143
Liver
— Gluconeogenesis
Glucose production
— Glycogenolysis: kidney/muscle
Glucagon
Epinephrine Hyperglycemia
Cortisol
Cytokines
Insulin-mediated uptake (GLUT-4) Noninsulin-mediated uptake
Glucose uptake — Post-receptor signaling defect (GLUT-1)
— Muscle glycogen
Oxidative metabolism
Glucose use
Nonoxidative metabolism
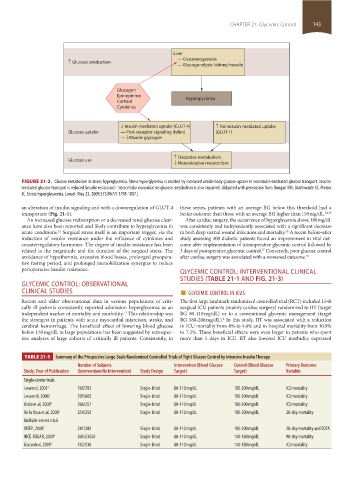
FIGURE 21-2. Glucose metabolism in stress hyperglycemia. Stress hyperglycemia is marked by increased whole-body glucose uptake in noninsulin-mediated glucose transport. Insulin-
mediated glucose transport is reduced (insulin resistance). Intracellular nonoxidative glucose metabolism is also impaired. (Adapted with permission from Dungan KM, Braithwaite SS, Preiser
JC. Stress hyperglycaemia. Lancet. May 23, 2009;373(9677):1798-1807.)
an alteration of insulin signaling and with a downregulation of GLUT-4 these series, patients with an average BG below this threshold had a
transporters (Fig. 21-1). better outcome than those with an average BG higher than 150 mg/dL. 14,15
An increased glucose reabsorption or a decreased renal glucose clear- After cardiac surgery, the occurrence of hyperglycemia above 180 mg/dL
ance have also been reported and likely contribute to hyperglycemia in was consistently and independently associated with a significant decrease
acute conditions. Surgical stress itself is an important trigger, via the in both deep sternal wound infections and mortality. A recent before-after
16
12
induction of insulin resistance under the influence of cytokines and study assessing 300 diabetic patients found an improvement in vital out-
counterregulatory hormones. The degree of insulin resistance has been come after implementation of intraoperative glycemic control followed by
related to the magnitude and the duration of the surgical stress. The 3 days of postoperative glycemic control. Conversely, poor glucose control
17
avoidance of hypothermia, excessive blood losses, prolonged preopera- after cardiac surgery was associated with a worsened outcome. 18
tive fasting period, and prolonged immobilization synergize to reduce
perioperative insulin resistance. GLYCEMIC CONTROL: INTERVENTIONAL CLINICAL
STUDIES (TABLE 21-1 AND FIG. 21-3)
GLYCEMIC CONTROL: OBSERVATIONAL
CLINICAL STUDIES ■ GLYCEMIC CONTROL IN ICUS
Recent and older observational data in various populations of criti- The first large landmark randomized controlled trial (RCT) included 1548
cally ill patients consistently reported admission hyperglycemia as an surgical ICU patients (mainly cardiac surgery) randomized to IIT (target
independent marker of mortality and morbidity. This relationship was BG 80-110 mg/dL) or to a conventional glycemic management (target
13
the strongest in patients with acute myocardial infarction, stroke, and BG 180-200 mg/dL). In this study, IIT was associated with a reduction
2
cerebral hemorrhage. The beneficial effect of lowering blood glucose in ICU mortality from 8% to 4.6% and in-hospital mortality from 10.9%
below 150 mg/dL in large populations has been suggested by retrospec- to 7.2%. These beneficial effects were even larger in patients who spent
tive analyses of large cohorts of critically ill patients. Consistently, in more than 5 days in ICU. IIT also lowered ICU morbidity expressed
TABLE 21-1 Summary of the Prospective Large-Scale Randomized Controlled Trials of Tight Glucose Control by Intensive Insulin Therapy
Number of Subjects Intervention (Blood Glucose Control (Blood Glucose Primary Outcome
Study, Year of Publication (Intervention/No Intervention) Study Design Target) Target) Variable
Single-center trials
Leuven I, 2001 2 765/783 Single-blind 80-110 mg/dL 180-200 mg/dL ICU mortality
Leuven II, 2006 3 595/605 Single-blind 80-110 mg/dL 180-200 mg/dL ICU mortality
Arabi et al, 2008 4 266/257 Single-blind 80-110 mg/dL 180-200 mg/dL ICU mortality
De la Rosa et al, 2008 5 254/250 Single-blind 80-110 mg/dL 180-200 mg/dL 28-day mortality
Multiple-center trials
VISEP, 2008 6 247/289 Single-blind 80-110 mg/dL 180-200 mg/dL 28-day mortality and SOFA
NICE-SUGAR, 2009 8 3054/3050 Single-blind 80-110 mg/dL 140-180 mg/dL 90-day mortality
Glucontrol, 2009 7 542/536 Single-blind 80-110 mg/dL 140-180 mg/dL ICU mortality
section02.indd 143 1/13/2015 2:05:00 PM