
Page 359 - Hall et al (2015) Principles of Critical Care-McGraw-Hill
P. 359
CHAPTER 31: The Pathophysiology of the Circulation in Critical Illness 229
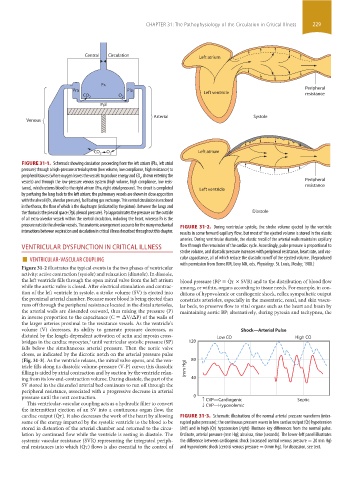
Central Circulation Left atrium
PA
Pra Pla Peripheral
CO 2 O 2 Left ventricle resistance
Ppl
Arterial Systole
Venous
CO 2 O 2 Left atrium
FIGURE 31-1. Schematic showing circulation proceeding from the left atrium (Pla, left atrial
pressure) through a high-pressure arterial system (low volume, low compliance, high resistance) to
peripheral tissues (where oxygen leaves the vessels to produce energy and CO , shown entering the
2
vessels) and through the low-pressure venous system (high volume, high compliance, low resis- Peripheral
tance), which returns blood to the right atrium (Pra, right atrial pressure). The circuit is completed Left ventricle resistance
by perfusing the lung back to the left atrium; the pulmonary vessels are shown in close apposition
with the alveoli (Pa, alveolar pressure), facilitating gas exchange. This central circulation is enclosed
in the thorax, the floor of which is the diaphragm (indicated by the piston). Between the lungs and
the thorax is the pleural space (Ppl, pleural pressure). Ppl approximates the pressure on the outside Diastole
of all extra-alveolar vessels within the central circulation, including the heart, whereas Pa is the
pressure outside the alveolar vessels. The anatomic arrangement accounts for the many mechanical FIGURE 31-2. During ventricular systole, the stroke volume ejected by the ventricle
interactions between respiration and circulation in critical illness described throughout this chapter. results in some forward capillary flow, but most of the ejected volume is stored in the elastic
arteries. During ventricular diastole, the elastic recoil of the arterial walls maintains capillary
VENTRICULAR DYSFUNCTION IN CRITICAL ILLNESS flow through the remainder of the cardiac cycle. Accordingly, pulse pressure is proportional to
■ VENTRICULAR-VASCULAR COUPLING cular capacitance, all of which reduce the diastolic runoff of the ejected volume. (Reproduced
stroke volume, and diastolic pressure increases with peripheral resistance, heart rate, and vas-
Figure 31-2 illustrates the typical events in the two phases of ventricular with permission from Berne RM, Levy MN, eds. Physiology. St. Louis, Mosby; 1988.)
activity: active contraction (systole) and relaxation (diastole). In diastole,
the left ventricle fills through the open mitral valve from the left atrium blood pressure (BP = Q ˙ t × SVR) and to the distribution of blood flow
while the aortic valve is closed. After electrical stimulation and contrac- among, or within, organs according to tissue needs. For example, in con-
tion of the left ventricle in systole, a stroke volume (SV) is ejected into ditions of hypovolemic or cardiogenic shock, reflex sympathetic output
the proximal arterial chamber. Because more blood is being ejected than constricts arterioles, especially in the mesenteric, renal, and skin vascu-
runs off through the peripheral resistance located in the distal arterioles, lar beds, to preserve flow to vital organs such as the heart and brain by
the arterial walls are distended outward, thus raising the pressure (P) maintaining aortic BP; alternatively, during pyrexia and tachypnea, the
in inverse proportion to the capacitance (C = ΔV/ΔP) of the walls of
the larger arteries proximal to the resistance vessels. As the ventricle’s
volume (V) decreases, its ability to generate pressure decreases, as Shock—Arterial Pulse
dictated by the length-dependent activation of actin and myosin cross- Low CO High CO
bridges in the cardiac myocytes, until ventricular systolic pressure (SP) 120
3
falls below the simultaneous arterial pressure. Then the aortic valve
closes, as indicated by the dicrotic notch on the arterial pressure pulse
(Fig. 31-3). As the ventricle relaxes, the mitral valve opens, and the ven- 80
tricle fills along its diastolic volume-pressure (V-P) curve; this diastolic (mm Hg)
filling is aided by atrial contraction and by suction by the ventricle relax-
ing from its low end-contraction volume. During diastole, the part of the 40
SV stored in the distended arterial bed continues to run off through the
peripheral resistance, associated with a progressive decrease in arterial
pressure until the next contraction. 0
This ventricular-vascular coupling acts as a hydraulic filter to convert CVP—Cardiogenic Septic
CVP—Hypovolemic
the intermittent ejection of an SV into a continuous organ flow, the
cardiac output (Q ˙ t). It also decreases the work of the heart by allowing FIGURE 31-3. Schematic illustrations of the normal arterial pressure waveform (inter-
some of the energy imparted by the systolic ventricle to the blood to be rupted pulse pressure); the continuous pressure waves in low cardiac output (Qt) hypotension
˙
stored in distention of the arterial chamber and returned to the circu- (left) and in high (Qt) hypotension (right) illustrate key differences from the normal pulse.
˙
lation by continued flow while the ventricle is resting in diastole. The Ordinate, arterial pressure (mm Hg); abscissa, time (seconds). The lower-left panel illustrates
systemic vascular resistance (SVR) representing the integrated periph- the difference between cardiogenic shock (increased central venous pressure = 20 mm Hg)
eral resistances into which (Q ˙ t) flows is also essential to the control of and hypovolemic shock (central venous pressure = 0 mm Hg). For discussion, see text.
section03.indd 229 1/23/2015 2:06:39 PM