
Page 363 - Hall et al (2015) Principles of Critical Care-McGraw-Hill
P. 363
CHAPTER 31: The Pathophysiology of the Circulation in Critical Illness 233
shown in Figure 31-5 and improve toward the normal continuous curves or a reduction in afterload, blood is shifted from the central compart-
when forward flow is increased by vasodilator therapy that lowers SVR ment to the stressed volume of the systemic circuit, thereby increasing
to allow more peripheral runoff and less regurgitant flow (see Chap. 41). Pms and VR ; moreover, improved ventricular pumping function
20
decreases Pra to increase VR further (see below).
CONTROL OF CARDIAC OUTPUT ■ VENOUS RETURN AND CARDIAC FUNCTION CURVES
BY THE SYSTEMIC VESSELS
Before the heart was started in the discussion above, Pra was equal to the
The heart is a mechanical pump that generates flow in the circulation. pressure throughout the vascular system, Pms. With each succeeding
Because Q ˙ t is the product of HR and SV, it is often erroneously assumed heartbeat, Pra decreases below Pms and VR increases. This sequence is
that the heart controls Q ˙ t. In fact VR to the right heart is controlled repeated in a more controlled, steady state by replacing the heart with a
by the systemic vessels, so the heart is more accurately described as pump set to keep Pra at a given value while VR is measured. Typical data
1,2
2
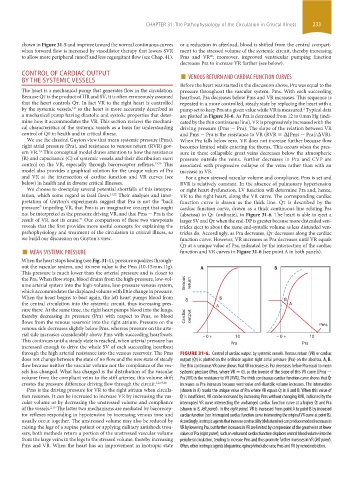
a mechanical pump having diastolic and systolic properties that deter- are plotted in Figure 31-6. As Pra is decreased from 12 to 0 mm Hg (indi-
mine how it accommodates the VR. This section reviews the mechani- cated by the thin continuous line), VR is progressively increased with the
cal characteristics of the systemic vessels as a basis for understanding driving pressure (Pms − Pra). The slope of the relation between VR
control of Q ˙ t in health and in critical illness. and Pms − Pra is the resistance to VR (RVR = Δ[Pms − Pra]/ΔVR).
We use the classical Guyton view that mean systemic pressure (Pms), When Pra falls below zero, VR does not increase further because flow
right atrial pressure (Pra), and resistance to venous return (RVR) gov- becomes limited while entering the thorax. This occurs when the pres-
ern VR. This conceptual model draws attention to how the resistance sure in these collapsible great veins decreases below the atmospheric
1,2
(R) and capacitance (C) of systemic vessels and their distribution exert pressure outside the veins. Further decreases in Pra and CVP are
control on the VR, especially through baroreceptor reflexes. 19,20 This associated with progressive collapse of the veins rather than with an
model also provides a graphical solution for the unique values of Pra increase in VR.
and VR at the intersection of cardiac function and VR curves (see For a given stressed vascular volume and compliance, Pms is set and
below) in health and in diverse critical illnesses. RVR is relatively constant. In the absence of pulmonary hypertension
We choose to downplay several potential shortfalls of this interpre- or right heart dysfunction, LV function will determine Pra and, hence,
tation, which some regard as fatal flaws. 21,22 Their analyses and inter- VR to the right heart, along the VR curve. The corresponding cardiac
pretation of Guyton’s experiments suggest that Pra is not the “back function curve is drawn as the thick line. Q ˙ t is described by the
pressure” impeding VR, that Pms is an imaginative concept that ought cardiac function curve, drawn as a thick continuous line relating Pra
not be interpreted as the pressure driving VR, and that Pms − Pra is the (abscissa) to Q ˙ t (ordinate), in Figure 31-6. The heart is able to eject a
result of VR, not its cause. Our comparison of these two viewpoints larger SV and Q ˙ t when the end-DP is greater because more distended ven-
21
reveals that the first provides more useful concepts for explaining the tricles eject to about the same end-systolic volume as less distended ven-
pathophysiology and treatment of the circulation in critical illness, so tricles do. Accordingly, as Pra decreases, Q ˙ t decreases along the cardiac
we build our discussion on Guyton’s view. function curve. However, VR increases as Pra decreases until VR equals
■ MEAN SYSTEMIC PRESSURE Q ˙ t at a unique value of Pra, indicated by the intersection of the cardiac
function and VR curves in Figure 31-6 (see point A in both panels).
When the heart stops beating (see Fig. 31-1), pressure equalizes through-
out the vascular system, and its new value is the Pms (10-15 mm Hg). A B
This pressure is much lower than the arterial pressure and is closer to
the Pra. When flow stops, blood drains from the high-pressure, low-vol-
ume arterial system into the high-volume, low-pressure venous system, Venous return
which accommodates the displaced volume with little change in pressure.
When the heart begins to beat again, the left heart pumps blood from B B
the central circulation into the systemic circuit, thus increasing pres- or A
sure there. At the same time, the right heart pumps blood into the lungs, A
thereby decreasing its pressure (Pra) with respect to Pms, so blood Cardiac output
flows from the venous reservoir into the right atrium. Pressure on the
venous side decreases slightly below Pms, whereas pressure on the arte- Pms
rial side increases considerably above Pms with succeeding heartbeats. – 0 + 10 – 0 + 10
This continues until a steady state is reached, when arterial pressure has
increased enough to drive the whole SV of each succeeding heartbeat Pra Pra
through the high arterial resistance into the venous reservoir. The Pms FIGURE 31-6. Control of cardiac output by systemic vessels. Venous return (VR) or cardiac
does not change between the state of no flow and the new state of steady output (Qt) is plotted on the ordinate against right atrial pressure (Pra) on the abscissa. A, B.
˙
flow because neither the vascular volume nor the compliance of the ves- The thin continuous VR curve shows that VR increases as Pra decreases below Pra equal to mean
sels has changed. What has changed is the distribution of the vascular systemic pressure (Pms, where VR = 0), so the inverse of the slope of this VR curve ([Pms −
volume from the compliant veins to the stiff arteries; this volume shift Pra]/VR) is the resistance to VR (RVR). The thick continuous cardiac function curve shows that Qt
˙
creates the pressure difference driving flow through the circuit. 1,2,19,20 increases as Pra increases because ventricular end-diastolic volume increases. The intersection
Pms is the driving pressure for VR to the right atrium when circula- (shown in A) marks the unique value of Pra where VR equals Qt in A and B. When this value of
˙
tion resumes. It can be increased to increase VR by increasing the vas- Qt is insufficient, VR can be increased by increasing Pms without changing RVR, indicated by the
˙
cular volume or by decreasing the unstressed volume and compliance interrupted VR curve intersecting the unchanged cardiac function curve at a higher Qt and Pra
˙
of the vessels. The latter two mechanisms are mediated by barorecep- (shown in B, left panel). In the right panel, VR is increased from point A to point B by increased
2,19
tor reflexes responding to hypotension by increasing venous tone and cardiac function (see interrupted cardiac function curve intersecting the original VR curve at point B).
usually occur together. The unstressed volume may also be reduced by Accordingly, inotropic agents that increase contractility (dobutamine) can produce modest increases in
raising the legs of a supine patient or applying military antishock trou- VR by lowering Pra, but further increases in VR are limited by compression of the great veins at lower
sers; both methods return a portion of the unstressed vascular volume values of Pra (right panel); such an enhanced cardiac function displaces central blood volume into the
from the large veins in the legs to the stressed volume, thereby increasing peripheral circulation, tending to increase Pms and thus promote further increases in VR (left panel).
Pms and VR. When the heart has an improvement in inotropic state Often, other inotropic agents (dopamine, epinephrine) also raise Pms and VR by venoconstriction.
section03.indd 233 1/23/2015 2:06:41 PM