
Page 364 - Hall et al (2015) Principles of Critical Care-McGraw-Hill
P. 364
234 PART 3: Cardiovascular Disorders
When Q ˙ t is insufficient, VR can be increased in several ways. A new regional resistances is offset by redistribution of blood flow to peripheral
steady state of increased VR is achieved by increasing Pms with no beds having low resistance and/or compliance.
change in RVR, indicated by the interrupted VR curve in the left panel One illustration of this effect is the opening of an abdominal arte-
of Figure 31-6. This new VR curve intersects the same cardiac function riovenous fistula between the aorta and the inferior vena cava, which
23
curve at a higher value of Q ˙ t at point B. This method of increasing doubles VR at the same values of Pms and Pra (Fig. 31-8). Consider
VR is associated with an increase in Pra. Due to the steep slope of the aliquots of blood leaving the left heart simultaneously; the aliquot tra-
cardiac function curve in normal hearts, large increases in VR occur versing the fistula returns to the right heart before the aliquot perfusing
with only small increases in Pra. Alternatively, VR can be increased the lower body returns. When a greater fraction of the Q ˙ t traverses the
by enhanced cardiac function by increasing contractility or decreasing open fistula having a very low compliance and resistance, more blood
afterload of the heart. This is depicted as an upward shift of the cardiac returns to the heart because RVR decreases. This manifestation of
function curve, as in the right panel of Figure 31-6, such that greater reduced RVR may account for poorly explained hemodynamic changes
Q ˙ t occurs at each Pra. The increase on each VR curve by this mecha- in septic shock, when high Q ˙ t is associated with increased blood flow
nism is associated with a reduction in Pra. Further, in the normal heart, to skeletal muscle, as if some metabolic stimulus increases the fraction
only a small change in VR is possible (from point A to point B in the of Q ˙ t perfusing the low resistance and low compliance skeletal muscle
right panel), and greater reductions in Pra do not increase Q ˙ t further bed, thereby reducing RVR and increasing VR. For another example,
because VR becomes flow limited as Pra decreases to below zero. This systemic hypoxemia triples VR. It does so by increasing Pms through
explains why inotropic agents that enhance contractility are ineffective venoconstriction to cause 70% of this increase, while redistribution of
in hypovolemic shock. Q ˙ t toward vascular beds having reduced capacitance and resistance
When cardiac pumping function is depressed, as depicted by the inter- account for 30% of the change. These vascular mechanisms are less
24
rupted line in Figure 31-7, VR is decreased from point A to point B for the predictable than observable, so future work may help understand effects
same value of Pms as Pra increases. The patient must then retain fluid or of acidemia, hypercapnia, and vasoactive drugs in critical illness.
initiate cardiac reflexes to increase Pms toward the new value required to Note in Figure 31-8 that increased VR from A to B is associated
maintain adequate Q ˙ t, as in chronic congestive heart failure. This is asso- with increased Pra when RVR is reduced without changing the cardiac
ciated with a large increase in Pra from point B to point C, which in turn function curve. In fact, Pra does not increase, and VR actually increases
causes jugular venous distention, hepatomegaly, and peripheral edema. from A to C, as if arteriovenous shunting improved cardiac function
Diuretic reduction of vascular volumes will correct these abnormalities at from the continuous to the interrupted cardiac function curve shown
the expense of decreasing Pms and VR. In contrast, inotropic and vaso- in the figure. One explanation is that reduced SVR associated with arte-
dilator drugs, which improve depressed cardiac function by shifting the riovenous shunting lowers the afterload on the left ventricle to improve
interrupted cardiac function curve upward, increase Q ˙ t and decrease Pra cardiac function. 17
more effectively than in patients with normal cardiac function.
■ RESISTANCE TO VENOUS RETURN
At a given Pms and Pra, VR is increased by reduced RVR. The RVR is
an average of all of the regional resistances. Each regional resistance (R)
is weighted by its contribution to the entire systemic vascular compli-
ance (C/C ) and to the fraction of the cardiac output draining from that
T
region (F/F ):
T C
RVR = R (C /C )(F /F ) + R (C /C )(F /F ) + … + R (C /C )(F /F )
1 1 T 1 T 2 2 T 2 T n n T n T Venous return
In most conditions, RVR remains relatively constant, increasing only
slightly with large adrenergic stimulation; even then the increase in B
or
D
Cardiac output A
Venous return or cardiac output
A C
B
– 0 + 10
Pra
– 0 + 10
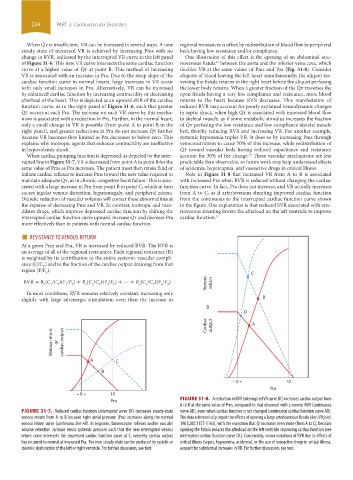
Pra FIGURE 31-8. A reduction in RVR (interrupted VR curve BC) increases cardiac output from
A to B at the same value of Pms, compared to that observed with a normal RVR (continuous
FIGURE 31-7. Reduced cardiac function (interrupted curve BC) decreases steady-state curve AD), even when cardiac function is not changed (continuous cardiac function curve AB).
venous return from A to B because right atrial pressure (Pra) increases along the normal The data schematically depict the effects of opening a large arteriovenous fistula (Am J Physiol.
venous return curve (continuous line AB). In response, baroreceptor reflexes and/or vascular 1961;200:1157-1163), with the exception that Qt increases even more (from A to C), because
˙
volume retention increase mean systemic pressure such that the new interrupted venous opening the fistula reduces the afterload on the left ventricle improving cardiac function (see
return curve intersects the depressed cardiac function curve at C, whereby cardiac output interrupted cardiac function curve DC). Conceivably, minor variations of RVR due to effects of
has returned to normal at increased Pra. The new steady state can be produced by systolic or critical illness (sepsis, hypoxemia, acidemia), or the use of vasoactive drugs in critical illness,
diastolic dysfunction of the left or right ventricle. For further discussion, see text. account for substantial increases in VR. For further discussion, see text.
section03.indd 234 1/23/2015 2:06:42 PM