
Page 360 - Hall et al (2015) Principles of Critical Care-McGraw-Hill
P. 360
230 PART 3: Cardiovascular Disorders
increased metabolic need demands a high Q ˙ t associated with dilation of A
the coronary and respiratory muscle vessels induced by accumulation
of anaerobic metabolites (eg, adenosine, H , and K ) and by local tissue
+
+
hypoxia, to maintain adequate O flow to these vital pumps. 100
2
Clinical evaluation of the cardiovascular system in patients with criti- B
cal illness is much aided by interpretation of the diastolic pressure (DP),
the pulse pressure (PP), and indices of SVR such as the rate of color
return to the nail bed after releasing pressure on the fingernail and digital
temperature. For example, a hypotensive patient with a heart rate (HR) Stroke volume A
of 110 beats/min, a SP/DP of 100/40 mm Hg, and warm extremities 50
with good color return to the nail bed has a high Q ˙ t and a low SVR (see
Fig. 31-3). This is because the large PP (60 mm Hg) signals a large SV,
which, when multiplied by the increased HR, produces increased Q ˙ t, and
the low DP indicates rapid peripheral runoff through low SVR confirmed
by digital examination and low mean BP (60 mm Hg) in the face of the
high Q ˙ t. In contrast, a second hypotensive patient with the same HR 10 20
and mean BP but an SP/DP of 80/65 mm Hg and cold extremities with
very slow return of color to the nail bed has a low Q ˙ t with increased Pla
SVR indicated by the small PP (hence, low SV and Q ˙ t), preserved DP, B
and constricted digital vessels. As indicated in the lower-left panel of
Figure 31-3, this low Q ˙ t hypotension is cardiogenic when the central venous 120
pressure (CVP) is high and hypovolemic when the CVP is low. Of course, Systolic
the relation between PP and SV is not quantitative, because it is propor- 100
tioned by an unknown constant—the vascular capacitance. Nevertheless,
in a given critically ill patient whose vascular capacitance changes 80
minimally in a course of acute interventions, a change in PP is the earliest
indicator of a change in SV. This correlation of PP with SV is evident in Ventricular pressure
one method of assessing the likelihood of arterial BP augmentation
in response to volume infusion in a mechanically ventilated patient. 2
4
As described below, increases in intrathoracic pressure during positive 20
pressure mechanical ventilation in a hypovolemic patient can result in Diastolic
a reduction of VR to the heart from the peripheral circulation. This, 10 1
in turn, results in a reduction in the stroke volume of the heart (SV),
which can be observed as a narrowing of the PP on the arterial tracing
(not shown; see Chap. 34.). 0 50 100 150
Ventricular volume
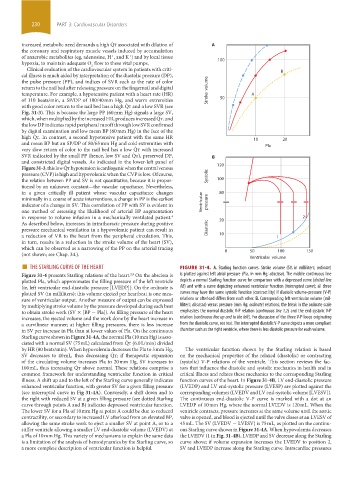
■ THE STARLING CURVE OF THE HEART FIGURE 31-4. A. Starling function curves. Stroke volume (SV, in milliliters; ordinate)
Figure 31-4 presents Starling relations of the heart. On the abscissa is is plotted against left atrial pressure (Pla, in mm Hg; abscissa). The middle continuous line
2,3
plotted Pla, which approximates the filling pressure of the left ventricle depicts a normal Starling function curve for comparison with a depressed curve (dotted line
(ie, left ventricular end-diastolic pressure [LVEDP]). On the ordinate is AB) and with a curve depicting enhanced ventricular function (interrupted curve); all three
plotted SV (in milliliters); this volume ejected per heartbeat is one mea- curves may have the same systolic function (contractility) if diastolic volume-pressure (V-P)
sure of ventricular output. Another measure of output can be expressed relations or afterload differs from each other. B. Corresponding left ventricular volume (mil-
by multiplying stroke volume by the pressure developed during each beat liliters; abscissa) versus pressure (mm Hg; ordinate) relations; the break in the ordinate scale
to obtain stroke work (SV × [BP − Pla]). As filling pressure of the heart emphasizes the normal diastolic V-P relation (continuous line 1,2) and the end-systolic V-P
increases, the ejected volume and the work done by the heart increase in relation (continuous line up and to the left). For discussion of the three V-P loops originating
a curvilinear manner; at higher filling pressures, there is less increase from the diastolic curve, see text. The interrupted diastolic V-P curve depicts a more compliant
in SV per increase in Pla than at lower values of Pla. On the continuous chamber such as the right ventricle, where there is less diastolic pressure for each volume.
Starling curve shown in Figure 31-4A, the normal Pla (10 mm Hg) is asso-
ciated with a normal SV (75 mL) calculated from Q ˙ t (6.0 L/min) divided
by HR (80 beats/min). When hypovolemia decreases the Pla to 5 mm Hg, The ventricular function shown by the Starling relation is based
SV decreases to 40 mL, thus decreasing Q ˙ t; if therapeutic expansion on the mechanical properties of the relaxed (diastolic) or contracting
of the circulating volume increases Pla to 20 mm Hg, SV increases to (systolic) V-P relations of the ventricle. This section reviews the fac-
100 mL, thus increasing Q ˙ t above normal. These relations comprise a tors that influence the diastolic and systolic mechanics in health and in
common framework for understanding ventricular function in critical critical illness and relates these mechanics to the corresponding Starling
illness. A shift up and to the left of the Starling curve generally indicates function curves of the heart. In Figure 31-4B, LV end-diastolic pressure
enhanced ventricular function, with greater SV for a given filling pressure (LVEDP) and LV end-systolic pressure (LVESP) are plotted against the
(see interrupted curve in Fig 31-4A). Conversely, a shift down and to corresponding volumes (LVEDV and LV end-systolic volume [LVESV]).
the right with reduced SV at a given filling pressure (see dotted Starling The continuous end-diastolic V-P curve is marked with a dot at an
curve through points A and B) indicates depressed ventricular function. LVEDP of 10 mm Hg, where the normal LVEDV is 120 mL. When the
The lower SV for a Pla of 10 mm Hg at point A could be due to reduced ventricle contracts, pressure increases at the same volume until the aortic
contractility, or secondary to increased LV afterload from an elevated BP, valve is opened, and blood is ejected until the valve closes at an LVESV of
allowing the same stroke work to eject a smaller SV at point A, or to a 45 mL. The SV (LVEDV − LVESV) is 75 mL, as plotted on the continu-
stiffer ventricle allowing a smaller LV end-diastolic volume (LVEDV) at ous Starling curve shown in Figure 31-4A. When hypovolemia decreases
a Pla of 10 mm Hg. This variety of mechanisms to explain the same data the LVEDV (1 in Fig. 31-4B), LVEDP and SV decrease along the Starling
is a limitation of the analysis of hemodynamics by the Starling curve, so curve above; if volume expansion increases the LVEDV to position 2,
a more complete description of ventricular function is helpful. SV and LVEDP increase along the Starling curve. Intracardiac pressures
section03.indd 230 1/23/2015 2:06:40 PM