
Page 399 - Hall et al (2015) Principles of Critical Care-McGraw-Hill
P. 399
CHAPTER 35: Ventricular Dysfunction in Critical Illness 269
the ESPVR. All ejections from different diastolic volumes end on the by heart rate yields cardiac output (arrow in Fig. 35-3, bottom panel).
ESPVR. The ESPVR shifts down and to the right when contractility Accordingly, an increase in ventricular contractility results in a leftward
17
decreases (Fig. 35-1B), resulting in decreased stroke volume at any given and upward shift of the ventricular pump function curve. An increase
afterload. Because of these characteristics, the ESPVR is a good index of in contractility from a normally steep ESPVR does not decrease ESV
ventricular contractility independent of changes in preload and afterload; much and therefore does not improve ventricular pump function much
because this slope is maximal at end systole and has the units of elastance (Fig. 35-4). This explains why increased contractility is only a minor
(E = ΔP/V), it has been denoted E or E . Stroke volume can also contributor to regulation of cardiac pump function in normal human
17
es
max
be decreased by impaired diastolic filling simply due to hypovolemia beings. In contrast, when ventricular contractility starts off depressed, as
(Fig. 35-1A) or due to decreased diastolic compliance (Fig. 35-1C). indicated by a decrease in slope of the ESPVR, an increase in contractil-
The cause of decreased diastolic compliance may be an intrinsically stiff ity significantly decreases ESV to improve ventricular pump function
diastolic ventricle (eg, due to ischemia or restrictive cardiomyopathy) or (see Fig. 35-4), thereby explaining why positive inotropic agents are
compression by external structures (eg, pericardial tamponade, constric- useful in acute treatment of dilated cardiomyopathies.
tive pericarditis, or elevated intrathoracic pressure from lungs, chest wall, A decrease in pressure afterload will result in a decrease in ESV, so
17
or from abdominal distention). The sloped characteristic of the ESPVR stroke volume and cardiac output increase, all else being constant.
means that increased afterload also decreases stroke volume (Fig. 35-1A). Thus, decreased afterload also improves ventricular pump function
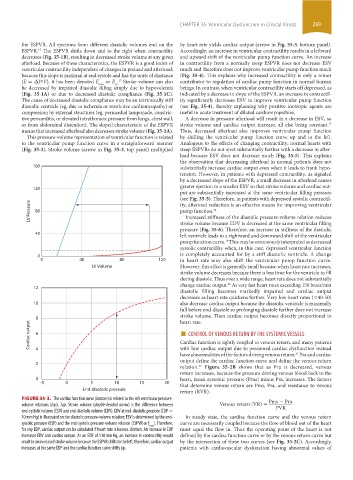
This pressure-volume representation of ventricular function is related by shifting the ventricular pump function curve up and to the left.
to the ventricular pump function curve in a straightforward manner Analogous to the effects of changing contractility, normal hearts with
(Fig. 35-3). Stroke volume (arrow in Fig. 35-3, top panel) multiplied steep ESPVRs do not eject substantially further with a decrease in after-
load because ESV does not decrease much (Fig. 35-5). This explains
the observation that decreasing afterload in normal patients does not
160 substantially increase cardiac output even when it leads to frank hypo-
tension. However, in patients with depressed contractility, as signaled
by a decreased slope of the ESPVR, a small decrease in afterload causes
120 greater ejection to a smaller ESV so that stroke volume and cardiac out-
put are substantially increased at the same ventricular filling pressure
(see Fig. 35-5). Therefore, in patients with depressed systolic contractil-
LV Pressure 80 pump function. 18
ity, afterload reduction is an effective means for improving ventricular
Increased stiffness of the diastolic pressure-volume relation reduces
stroke volume because EDV is decreased at the same ventricular filling
pressure (Fig. 35-6). Therefore, an increase in stiffness of the diastolic
40
left ventricle leads to a rightward and downward shift of the ventricular
pump function curve. This may be erroneously interpreted as decreased
19
systolic contractility when, in this case, depressed ventricular function
0 is completely accounted for by a stiff diastolic ventricle. A change
0 40 80 120 in heart rate may also shift the ventricular pump function curve.
LV Volume However, this effect is generally small because when heart rate increases,
stroke volume decreases because there is less time for the ventricle to fill
during diastole. Thus over a wide range, heart rate does not substantially
change cardiac output. At very fast heart rates exceeding 150 beats/min
20
12
diastolic filling becomes markedly impaired and cardiac output
decreases as heart rate quickens further. Very low heart rates (<40-50)
10 also decrease cardiac output because the diastolic ventricle is maximally
full before end-diastole so prolonging diastole further does not increase
stroke volume. Then cardiac output becomes directly proportional to
8 heart rate.
Cardiac output 6 Cardiac function is tightly coupled to venous return, and many patients
■
CONTROL OF VENOUS RETURN BY THE SYSTEMIC VESSELS
with low cardiac output due to presumed cardiac dysfunction instead
4
have abnormalities of the factors driving venous return. Pra and cardiac
21
output define the cardiac function curve and define the venous return
2
relation. Figure 35-2B shows that as Pra is decreased, venous
22
return increases, because the pressure driving venous blood back to the
0 heart, mean systemic pressure (Pms) minus Pra, increases. The factors
–5 0 5 10 15 20 that determine venous return are Pms, Pra, and resistance to venous
End-diastolic pressure return (RVR).
FIGURE 35-3. The cardiac function curve (bottom) is related to the left ventricular pressure- Pms − Pra
volume relations (top). Top. Stroke volume (double-headed arrow) is the difference between Venous return (VR) = PVR
end-systolic volume (ESV) and end-diastolic volume (EDV). EDV at end-diastolic pressure (EDP =
10 mm Hg) is illustrated on the diastolic pressure-volume relation; ESV is determined by the end- In steady state, the cardiac function curve and the venous return
systolic pressure (ESP) and the end-systolic pressure-volume relation (ESPVR or E ). Therefore, curve are necessarily coupled because the flow of blood out of the heart
max
for any EDP, cardiac output can be calculated if heart rate is known. Bottom. An increase in EDP must equal the flow in. Thus the operating point of the heart is not
increases EDV and cardiac output. At an EDP of 510 mm Hg, an increase in contractility would defined by the cardiac function curve or by the venous return curve but
result in an increased stroke volume because the ESPVR shifts to the left; therefore, cardiac output by the intersection of these two curves (see Fig. 35-2C). Accordingly,
increases at the same EDP and the cardiac function curve shifts up. patients with cardiovascular dysfunction having abnormal values of
section03.indd 269 1/23/2015 2:07:02 PM