
Page 683 - Hall et al (2015) Principles of Critical Care-McGraw-Hill
P. 683
502 PART 4: Pulmonary Disorders
A 60 B 60
Ppk 50 8 <0.001 Ppk 50
(cm H 2 O) 8 <0.02
40 40
(cm H 2 O) 30
30
Pplat 8 <0.01
Pplat 20 8 <0.01 (cm H 2 O) 20 2.5
10
10
2.0 2.0
8 <0.01 8 <0.01
V EI
(L) 1.5
V EI 1.5
(L)
1.0
1.0
V T V T
V EI V EI
V EE
V EE 5
0.5
FRC
FRC V T (L) 0.6 1.0 1.6
V I (L/min) 100 40 R (b/min) 27 ± 5 13 ± 3 7 ± 2
V T (L) 1.0 1.0 V E (L/min) 16 ± 3 13 ± 3 11 ± 3
V E (L/min) 13.3 ± 2.8 13.3 ± 2.8 V I (L/min) 100 100 100
157 ± 36 133 ± 34 8 <0.01 (mm Hg) 7 NS
Pa O 2 Pa O 2 137 ± 41 157 ± 36 152 ± 25
37 ± 8 37 ± 7 8 NS (mm Hg) 38 ± 6 37 ± 8 38 ± 6 7 NS
Pa CO 2 Pa CO 2
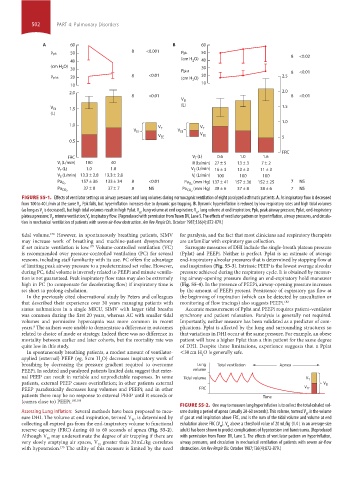
FIGURE 55-1. Effects of ventilator settings on airway pressures and lung volumes during normocapnic ventilation of eight paralyzed asthmatic patients. A. As inspiratory flow is decreased
from 100 to 40 L/min at the same V , Ppk falls, but hyperinflation increases due to dynamic gas trapping. B. Dynamic hyperinflation is reduced by low respiratory rates and high tidal volumes
E
(as long as V is decreased), but high tidal volumes result in high Pplat. V , lung volume at end expiration; V , lung volume at end inspiration; Ppk, peak airway pressure; Pplat, end-inspiratory
E
EE
EI
plateau pressure; V , minute ventilation; V, inspiratory flow. (Reproduced with permission from Tuxen DV, Lane S. The effects of ventilator pattern on hyperinflation, airway pressures, and circula-
E
I
tion in mechanical ventilation of patients with severe air-flow obstruction. Am Rev Respir Dis. October 1987;136(4):872-879.)
tidal volume. However, in spontaneously breathing patients, SIMV for paralysis, and the fact that most clinicians and respiratory therapists
178
may increase work of breathing and machine-patient dyssynchrony are unfamiliar with expiratory gas collection.
if set minute ventilation is low. Volume-controlled ventilation (VC) Surrogate measures of DHI include the single-breath plateau pressure
179
is recommended over pressure-controlled ventilation (PC) for several (Pplat) and PEEPi. Neither is perfect. Pplat is an estimate of average
reasons, including staff familiarity with its use. PC offers the advantage end-inspiratory alveolar pressures that is determined by stopping flow at
of limiting peak airway pressure to a predetermined set value. However, end inspiration (Fig. 55-3). Intrinsic PEEP is the lowest average alveolar
during PC, tidal volume is inversely related to PEEPi and minute ventila- pressure achieved during the respiratory cycle. It is obtained by measur-
tion is not guaranteed. Peak inspiratory flow rates may also be extremely ing airway-opening pressure during an end-expiratory hold maneuver
high in PC (to compensate for decelerating flow) if inspiratory time is (Fig. 55-4). In the presence of PEEPi, airway-opening pressure increases
set short to prolong exhalation. by the amount of PEEPi present. Persistence of expiratory gas flow at
In the previously cited observational study by Peters and colleagues the beginning of inspiration (which can be detected by auscultation or
that described their experience over 30 years managing patients with monitoring of flow tracings) also suggests PEEPi. 182
status asthmaticus in a single MICU, SIMV with larger tidal breaths Accurate measurement of Pplat and PEEPi requires patient-ventilator
was common during the first 20 years, whereas AC with smaller tidal synchrony and patient relaxation. Paralysis is generally not required.
volumes and permissive hypercapnia was more common in recent Importantly, neither measure has been validated as a predictor of com-
years. The authors were unable to demonstrate a difference in outcomes plications. Pplat is affected by the lung and surrounding structures so
8
related to choice of mode or strategy. Indeed there was no difference in that variations in DHI occur at the same pressure. For example, an obese
mortality between earlier and later cohorts, but the mortality rate was patient will have a higher Pplat than a thin patient for the same degree
quite low in this study. of DHI. Despite these limitations, experience suggests that a Pplat
In spontaneously breathing patients, a modest amount of ventilator- <30 cm H O is generally safe.
applied (external) PEEP (eg, 5 cm H O) decreases inspiratory work of 2
2
breathing by decreasing the pressure gradient required to overcome Lung Total ventilation Apnea
PEEPi. In sedated and paralyzed patients limited data suggest that exter- volume
nal PEEP can result in variable and unpredictable responses. In some Tidal volume V T
patients, external PEEP causes overinflation; in other patients external V EI
PEEP paradoxically decreases lung volumes and PEEPi; and in other FRC V EE
patients there may be no response to external PEEP until it exceeds or Time
(comes close to) PEEPi. 180,181
FIGURE 55-2. One way to measure lung hyperinflation is to collect the total exhaled vol-
Assessing Lung Inflation: Several methods have been proposed to mea- ume during a period of apnea (usually 20-60 seconds). This volume, termed V , is the volume
EI
sure DHI. The volume at end inspiration, termed V , is determined by of gas at end inspiration above FRC, and is the sum of the tidal volume and volume at end
EI
collecting all expired gas from the end-inspiratory volume to functional exhalation above FRC (V ). V above a threshold value of 20 mL/kg (1.4 L in an average-size
EI
EE
reserve capacity (FRC) during 40 to 60 seconds of apnea (Fig. 55-2). adult) has been shown to predict complications of hypotension and barotrauma. (Reproduced
Although V may underestimate the degree of air trapping if there are with permission from Tuxen DV, Lane S. The effects of ventilator pattern on hyperinflation,
EI
very slowly emptying air spaces, V greater than 20 mL/kg correlates airway pressures, and circulation in mechanical ventilation of patients with severe air-flow
EI
with hypotension. The utility of this measure is limited by the need obstruction. Am Rev Respir Dis. October 1987;136(4):872-879.)
175
section04.indd 502 1/23/2015 2:20:15 PM