
Page 687 - Hall et al (2015) Principles of Critical Care-McGraw-Hill
P. 687
506 PART 4: Pulmonary Disorders
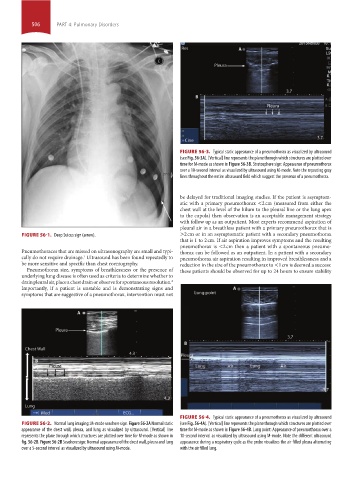
FIGURE 56-3. Typical static appearance of a pneumothorax as visualized by ultrasound
(see Fig. 56-3A). [Vertical] line represents the plane through which structures are plotted over
time for M-mode as shown in Figure 56-3B. Stratosphere sign: Appearance of pneumothorax
over a 10-second interval as visualized by ultrasound using M-mode. Note the repeating gray
lines throughout the entire ultrasound field which suggest the presence of a pneumothorax.
be delayed for traditional imaging studies. If the patient is asymptom-
atic with a primary pneumothorax <2 cm (measured from either the
chest wall at the level of the hilum to the pleural line or the lung apex
to the cupola) then observation is an acceptable management strategy
with follow up as an outpatient. Most experts recommend aspiration of
pleural air in a breathless patient with a primary pneumothorax that is
FIGURE 56-1. Deep Sulcus sign (arrow). >2 cm or in an asymptomatic patient with a secondary pneumothorax
that is 1 to 2 cm. If air aspiration improves symptoms and the resulting
pneumothorax is <2 cm then a patient with a spontaneous pneumo-
Pneumothoraces that are missed on ultrasonography are small and typi- thorax can be followed as an outpatient. In a patient with a secondary
cally do not require drainage. Ultrasound has been found repeatedly to pneumothorax air aspiration resulting in improved breathlessness and a
7
be more sensitive and specific than chest roentography. reduction in the size of the pneumothorax to <1 cm is deemed a success:
Pneumothorax size, symptoms of breathlessness or the presence of these patients should be observed for up to 24 hours to ensure stability
underlying lung disease is often used as criteria to determine whether to
drain pleural air, place a chest drain or observe for spontaneous resolution.
2
Importantly, if a patient is unstable and is demonstrating signs and
symptoms that are suggestive of a pneumothorax, intervention must not
FIGURE 56-4. Typical static appearance of a pneumothorax as visualized by ultrasound
FIGURE 56-2. Normal lung imaging: M-mode seashore sign. Figure 56-2A Normal static (see Fig. 56-4A). [Vertical] line represents the plane through which structures are plotted over
appearance of the chest wall, pleura, and lung as visualized by ultrasound. [Vertical] line time for M-mode as shown in Figure 56-4B. Lung point: Appearance of pneumothorax over a
represents the plane through which structures are plotted over time for M-mode as shown in 10-second interval as visualized by ultrasound using M-mode. Note the different ultrasound
fig. 56-2B. Figure 56-2B Seashore sign: Normal appearance of the chest wall, pleura and lung appearance during a respiratory cycle as the probe visualizes the air filled pleura alternating
over a 5-second interval as visualized by ultrasound using M-mode. with the air filled lung.
section04.indd 506 1/23/2015 2:20:19 PM