
Page 684 - Hall et al (2015) Principles of Critical Care-McGraw-Hill
P. 684
CHAPTER 55: Status Asthmaticus 503
Peak Pause
Pressure
Inhalation Exhalation
Flow
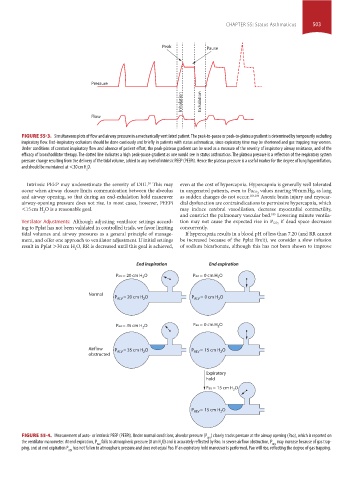
FIGURE 55-3. Simultaneous plots of flow and airway pressure in a mechanically ventilated patient. The peak-to-pause or peak-to-plateau gradient is determined by temporarily occluding
inspiratory flow. End-inspiratory occlusions should be done cautiously and briefly in patients with status asthmaticus, since expiratory time may be shortened and gas trapping may worsen.
Under conditions of constant inspiratory flow and absence of patient effort, the peak-plateau gradient can be used as a measure of the severity of inspiratory airway resistance, and of the
efficacy of bronchodilator therapy. The dotted line indicates a high peak-pause gradient as one would see in status asthmaticus. The plateau pressure is a reflection of the respiratory system
pressure change resulting from the delivery of the tidal volume, added to any level of intrinsic PEEP (PEEPi). Hence the plateau pressure is a useful marker for the degree of lung hyperinflation,
and should be maintained at <30 cm H O.
2
Intrinsic PEEP may underestimate the severity of DHI. This may even at the cost of hypercapnia. Hypercapnia is generally well tolerated
28
occur when airway closure limits communication between the alveolus in oxygenated patients, even to Pa CO 2 values nearing 90 mm Hg, as long
and airway opening, so that during an end-exhalation hold maneuver as sudden changes do not occur. 183,184 Anoxic brain injury and myocar-
airway-opening pressure does not rise. In most cases, however, PEEPi dial dysfunction are contraindications to permissive hypercapnia, which
<15 cm H O is a reasonable goal. may induce cerebral vasodilation, decrease myocardial contractility,
2
and constrict the pulmonary vascular bed. Lowering minute ventila-
185
Ventilator Adjustments: Although adjusting ventilator settings accord- tion may not cause the expected rise in P CO 2 if dead space decreases
ing to Pplat has not been validated in controlled trials, we favor limiting concurrently.
tidal volumes and airway pressures as a general principle of manage- If hypercapnia results in a blood pH of less than 7.20 (and RR cannot
ment, and offer one approach to ventilator adjustment. If initial settings be increased because of the Pplat limit), we consider a slow infusion
result in Pplat >30 cm H O, RR is decreased until this goal is achieved, of sodium bicarbonate, although this has not been shown to improve
2
End inspiration End expiration
Pao = 20 cm H O Pao = 0 cm H O
2
2
Normal
2
2
P ALV = 20 cm H O P ALV = 0 cm H O
Pao = 35 cm H O Pao = 0 cm H O
2
2
Airflow P ALV = 35 cm H O P ALV = 15 cm H O
2
2
obstructed
Expiratory
hold
Pao = 15 cm H O
2
P ALV = 15 cm H O
2
FIGURE 55-4. Measurement of auto- or intrinsic PEEP (PEEPi). Under normal conditions, alveolar pressure (P ) closely tracks pressure at the airway opening (Pao), which is reported on
ALV
the ventilator manometer. At end expiration, P falls to atmospheric pressure (0 cm H O) and is accurately reflected by Pao. In severe airflow obstruction, P may increase because of gas trap-
ALV
2
ALV
ping, and at end expiration P has not fallen to atmospheric pressure and does not equal Pao. If an expiratory hold maneuver is performed, Pao will rise, reflecting the degree of gas trapping.
ALV
section04.indd 503 1/23/2015 2:20:16 PM