
Page 262 - Clinical Application of Mechanical Ventilation
P. 262
228 Chapter 8
TABLE 8-12 I Time % and I:E Ratio Equivalent
I Time % I:E Ratio
14.3% 1:6
16.7% 1:5
20% 1:4
25% 1:3
33.3% 1:2
50% 1:1
60% 1.5:1
66.7% 2:1
© Cengage Learning 2014
phase. The initial peak flow at the very beginning of the inspiratory phase should
help to overcome the airway resistance and parenchymal elastance, and the remain-
ing peak flow throughout the inspiratory phase should enhance gas distribution in
the lungs. Adjustment of the flow pattern may be made after stabilization of the pa-
tient. Note that the constant flow pattern is the only flow pattern in which the peak
flow rate equals the mean flow rate. All other flow patterns will produce a mean flow
rate that is less than the peak flow.
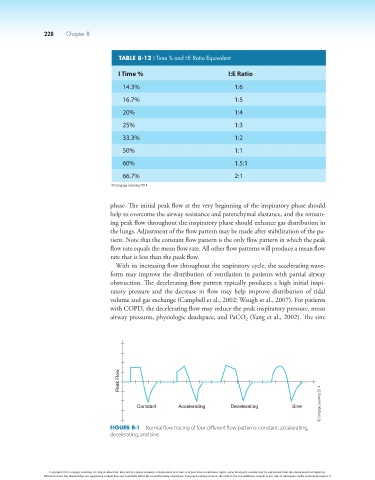
With its increasing flow throughout the respiratory cycle, the accelerating wave-
form may improve the distribution of ventilation in patients with partial airway
obstruction. The decelerating flow pattern typically produces a high initial inspi-
ratory pressure and the decrease in flow may help improve distribution of tidal
volume and gas exchange (Campbell et al., 2002; Waugh et al., 2007). For patients
with COPD, the decelerating flow may reduce the peak inspiratory pressure, mean
airway pressures, physiologic deadspace, and PaCO (Yang et al., 2002). The sine
2
Peak Flow
© Cengage Learning 2014
Constant Accelerating Decelerating Sine
Figure 8-1 Normal flow tracing of four different flow patterns: constant, accelerating,
decelerating, and sine.
Copyright 2013 Cengage Learning. All Rights Reserved. May not be copied, scanned, or duplicated, in whole or in part. Due to electronic rights, some third party content may be suppressed from the eBook and/or eChapter(s).
Editorial review has deemed that any suppressed content does not materially affect the overall learning experience. Cengage Learning reserves the right to remove additional content at any time if subsequent rights restrictions require it.