
Page 346 - Clinical Application of Mechanical Ventilation
P. 346
312 Chapter 11
The use of the sine or ascending ramp flow waveforms may be appropriate for
controlled ventilation where patient effort, flow, or volume of gas being demanded
is not an issue. When a patient is heavily sedated and there is no patient effort to
breathe, the slow rise to set peak flow levels may improve lung gas distribution
because there is less resistance to gas flow. Higher flow rates cause higher resistance
to flow. Also, when there is variable flow resistance in diseased airways throughout
the lungs, gas follows the path of least resistance, preferentially ventilating normal
lung parenchyma. Utilizing slower flow rates or rise time to set peak flow levels
may reduce flow resistance and improve gas distribution to the poorly ventilated
areas of the lung. During assisted (patient-triggered) ventilation, however, there is
a time lag between patient demand for flow because of ventilator inspiratory valve
opening response time and time for gas to accelerate to the flow level demanded.
When the initial flow level is set higher than demanded, it will often compensate
for this time lag and improve ventilator-patient synchrony (Marini et al., 1985).
EFFECTS OF CONSTANT FLOW DURING
VOLUME-CONTROLLED VENTILATION
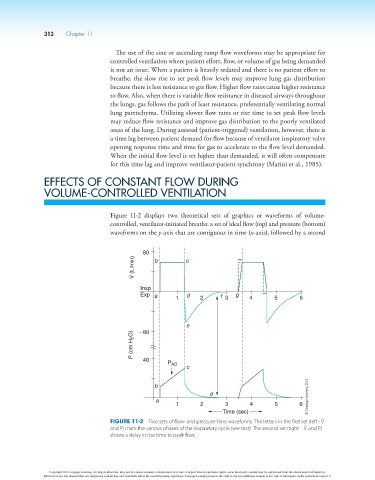
Figure 11-2 displays two theoretical sets of graphics or waveforms of volume-
controlled, ventilator-initiated breaths: a set of ideal flow (top) and pressure (bottom)
waveforms on the y-axis that are contiguous in time (x-axis), followed by a second
80
V (L/min) b c
Insp
Exp a 1 d 2 f 3 g 4 5 6
e
280
P (cm H 2 O)
40
P
AO
c
b
d
a © Cengage Learning 2014
1 2 3 4 5 6
Time (sec)
#
Figure 11-2 Two sets of flow- and pressure-time waveforms. The letters in the first set (left - V
#
and P) mark the various phases of the respiratory cycle (see text). The second set (right - V and P)
shows a delay in rise time to peak flow.
Copyright 2013 Cengage Learning. All Rights Reserved. May not be copied, scanned, or duplicated, in whole or in part. Due to electronic rights, some third party content may be suppressed from the eBook and/or eChapter(s).
Editorial review has deemed that any suppressed content does not materially affect the overall learning experience. Cengage Learning reserves the right to remove additional content at any time if subsequent rights restrictions require it.