
Page 349 - Clinical Application of Mechanical Ventilation
P. 349
Ventilator Waveform Analysis 315
the end of expiratory pressure being sensed by the pressure manometer. The bold,
double-headed arrow shows that flow is still being recorded as gas is passing through
the pneumotachometer at the expiratory valve. The manometer is not sufficiently
sensitive or appropriately placed at the expiratory valve for pressure to be continu-
ously recorded until end-expiratory flow is reached on some ventilators.
In the second flow waveform (Figure 11-2), the time involved (upper double-
headed arrow) for the rise to peak flow is exaggerated to show a time lag between
the beginning of inspiration and attainment of peak flow. This example is presented
only to evaluate the idea conceptually. This delay in time corresponds to a loss in
flow, and, therefore, of volume in the initial phase of inspiration. At the end of
inspiration, the volume lost initially is regained as the flow slows to zero over the
same delay in time and area under the flow pattern (lower doubled-headed arrow).
The peak flow could have been increased to regain the volume lost initially, instead of
time being extended. Thus, flow-controlled ventilation equates to volume-controlled
ventilation. The concept concerning volume and the area under the flow pattern
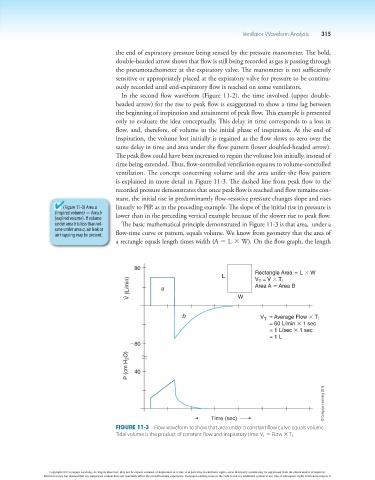
is explained in more detail in Figure 11-3. The dashed line from peak flow to the
recorded pressure demonstrates that once peak flow is reached and flow remains con-
stant, the initial rise in predominantly flow-resistive pressure changes slope and rises
(Figure 11-3) Area a linearly to PIP, as in the preceding example. The slope of the initial rise in pressure is
(inspired volume) 5 Area b lower than in the preceding vertical example because of the slower rise to peak flow.
(expired volume). If volume
under area b is less than vol- The basic mathematical principle demonstrated in Figure 11-3 is that area, under a
ume under area a, air leak or
air trapping may be present. flow-time curve or pattern, equals volume. We know from geometry that the area of
a rectangle equals length times width (A 5 L * W). On the flow graph, the length
80
L Rectangle Area = L 3 W
V = V 3 T
V (L/min) a W Area A = Area B
I
T
b V = Average Flow 3 T I
T
= 60 L/min 3 1 sec
= 1 L/sec 3 1 sec
= 1 L
280
P (cm H 2 O) 40
© Cengage Learning 2014
Time (sec)
Figure 11-3 Flow waveform to show that area under a constant flow curve equals volume.
Tidal volume is the product of constant flow and inspiratory time: V T 5 Flow 3 T I .
Copyright 2013 Cengage Learning. All Rights Reserved. May not be copied, scanned, or duplicated, in whole or in part. Due to electronic rights, some third party content may be suppressed from the eBook and/or eChapter(s).
Editorial review has deemed that any suppressed content does not materially affect the overall learning experience. Cengage Learning reserves the right to remove additional content at any time if subsequent rights restrictions require it.