
Page 350 - Clinical Application of Mechanical Ventilation
P. 350
316 Chapter 11
side of the waveform (y-axis) is 60 L/min or 1 L/s (60 L/min * 1 min/60s 5 1 L/s).
tidal volume (V T ): Volume
delivered by ventilator during Flow is constant for 1 second, therefore, the width of the rectangle (x-axis) is 1 second
mandatory breaths. and, since length times width equals area, 1 L/s * 1s 5 1 liter tidal volume (V )
T
delivered. Also, constant flow means there is a constant delivery of volume per unit
time. For example, if 0.25s is used as the unit of time, a 0.25 liter of gas is delivered
Constant Peak Flow 3 every 0.25s (Volume 5 1 L/s * 0.25s 5 0.25 L).
I Time 5 Tidal Volume
Since patients exhale what they inhale, it can be stated that area b enclosed under
the expiratory flow wave equals area a under the CFW. If the volume enclosed by
area b during mechanical ventilation is less than area a, then there must either be
a leak in the circuit, some gas has not been expired, or has been trapped in the
patient’s lungs momentarily. The pressure pattern shows a constant rise in lung pres-
sure during the constant flow period as discussed earlier in Figure 11-2.
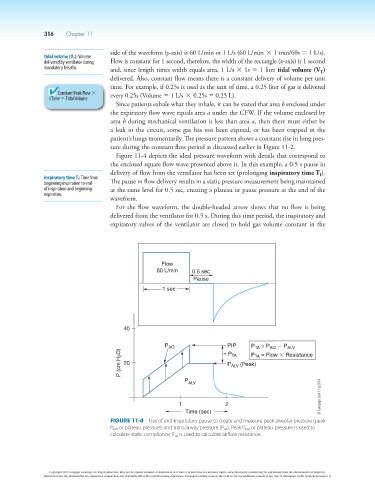
Figure 11-4 depicts the ideal pressure waveform with details that correspond to
the enclosed square flow wave presented above it. In this example, a 0.5 s pause in
delivery of flow from the ventilator has been set (prolonging inspiratory time T ).
I
inspiratory time T I : Time from
beginning inspiration to end The pause in flow delivery results in a static pressure measurement being maintained
of inspiration and beginning at the same level for 0.5 sec, creating a plateau or pause pressure at the end of the
expiration.
waveform.
For the flow waveform, the double-headed arrow shows that no flow is being
delivered from the ventilator for 0.5 s. During this time period, the inspiratory and
expiratory valves of the ventilator are closed to hold gas volume constant in the
Flow
60 L/min 0.5 sec
Pause
1 sec
40
P AO = P P = P AO 2 P ALV
PIP
TA
P (cm H 2 O) 20 P ALV (Peak) TA
P = Flow 3 Resistance
TA
P
© Cengage Learning 2014
ALV
1 2
Time (sec)
Figure 11-4 Use of end-inspiratory pause to create and measure peak alveolar pressure (peak
P ALV or plateau pressure) and transairway pressure (P TA ). Peak P ALV or plateau pressure is used to
calculate static compliance; P TA is used to calculate airflow resistance.
Copyright 2013 Cengage Learning. All Rights Reserved. May not be copied, scanned, or duplicated, in whole or in part. Due to electronic rights, some third party content may be suppressed from the eBook and/or eChapter(s).
Editorial review has deemed that any suppressed content does not materially affect the overall learning experience. Cengage Learning reserves the right to remove additional content at any time if subsequent rights restrictions require it.