
Page 637 - Clinical Application of Mechanical Ventilation
P. 637
Mechanical Ventilation in Nontraditional Settings 603
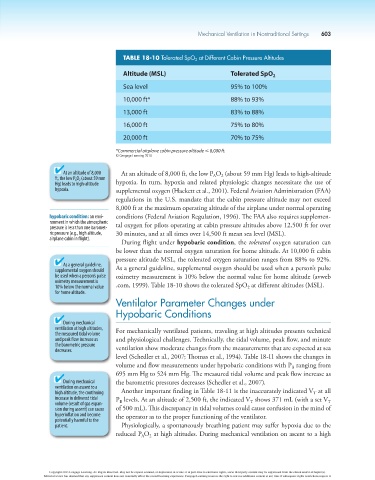
TABLE 18-10 Tolerated SpO 2 at Different Cabin Pressure Altitudes
Altitude (MSL) Tolerated SpO 2
Sea level 95% to 100%
10,000 ft* 88% to 93%
13,000 ft 83% to 88%
16,000 ft 75% to 80%
20,000 ft 70% to 75%
*Commercial airplane cabin pressure altitude # 8,000 ft.
© Cengage Learning 2014
At an altitude of 8,000 At an altitude of 8,000 ft, the low P O (about 59 mm Hg) leads to high-altitude
ft, the low P A O 2 (about 59 mm A 2
Hg) leads to high-altitude hypoxia. In turn, hypoxia and related physiologic changes necessitate the use of
hypoxia. supplemental oxygen (Hackett et al., 2001). Federal Aviation Administration (FAA)
regulations in the U.S. mandate that the cabin pressure altitude may not exceed
8,000 ft at the maximum operating altitude of the airplane under normal operating
hypobaric condition: an envi- conditions (Federal Aviation Regulation, 1996). The FAA also requires supplemen-
ronment in which the atmospheric tal oxygen for pilots operating at cabin pressure altitudes above 12,500 ft for over
pressure is less than one baromet-
ric pressure (e.g., high altitude, 30 minutes, and at all times over 14,500 ft mean sea level (MSL).
airplane cabin in flight).
During flight under hypobaric condition, the tolerated oxygen saturation can
be lower than the normal oxygen saturation for home altitude. At 10,000 ft cabin
pressure altitude MSL, the tolerated oxygen saturation ranges from 88% to 92%.
As a general guideline, As a general guideline, supplemental oxygen should be used when a person’s pulse
supplemental oxygen should
be used when a person’s pulse oximetry measurement is 10% below the normal value for home altitude (avweb
oximetry measurement is
10% below the normal value .com, 1999). Table 18-10 shows the tolerated SpO at different altitudes (MSL).
2
for home altitude.
Ventilator Parameter Changes under
Hypobaric Conditions
During mechanical
ventilation at high altitudes, For mechanically ventilated patients, traveling at high altitudes presents technical
the measured tidal volume
and peak flow increase as and physiological challenges. Technically, the tidal volume, peak flow, and minute
the barometric pressure
decreases. ventilation show moderate changes from the measurements that are expected at sea
level (Schedler et al., 2007; Thomas et al., 1994). Table 18-11 shows the changes in
volume and flow measurements under hypobaric conditions with P ranging from
B
695 mm Hg to 524 mm Hg. The measured tidal volume and peak flow increase as
During mechanical the barometric pressures decreases (Schedler et al., 2007).
ventilation on ascent to a
high altitude, the continuing Another important finding in Table 18-11 is the inaccurately indicated V at all
T
increase in delivered tidal P levels. At an altitude of 2,500 ft, the indicated V shows 371 mL (with a set V
volume (result of gas expan- B T T
sion during ascent) can cause of 500 mL). This discrepancy in tidal volumes could cause confusion in the mind of
hyperinflation and become the operator as to the proper functioning of the ventilator.
potentially harmful to the
patient. Physiologically, a spontaneously breathing patient may suffer hypoxia due to the
reduced P O at high altitudes. During mechanical ventilation on ascent to a high
A
2
Copyright 2013 Cengage Learning. All Rights Reserved. May not be copied, scanned, or duplicated, in whole or in part. Due to electronic rights, some third party content may be suppressed from the eBook and/or eChapter(s).
Editorial review has deemed that any suppressed content does not materially affect the overall learning experience. Cengage Learning reserves the right to remove additional content at any time if subsequent rights restrictions require it.