Page 413 - Cardiac Nursing
P. 413

4 P
                                        M
                                     4 P
                                   1:2
                                   1:2
                                        M
                                           g
                                           g
                                          Pa
                                          Pa
                                          Pa
                              /29
                              /29
                             6
                           xd
                             6
                                /09
                                   1
                                   1
                                    1
                                /09
                                /09
                                                   a
                                                   a
                                                  ara
                                                  t
                                                  ara
                                                   a
                                                      c.
                                                      c.
                                                    In
                                                   a
                                                    In
                                              89
                                              89
                                            e 3
                                           g
                                            e 3
                                                A
                                                 p
                                                  t
                                                 p
                                                A
                                                 p
                   p
                   p
                    38
                      8-3
                    38
         LWB K34 0-c 17_ pp388-399.qxd  6/29/09  11:24 PM  Page 389 Aptara Inc.
            K34
         LWB
               0-c
         LWBK340-c17_
                 17_
                      8-3
                          q
                          q
                          q
                        99.
                           xd
                        99.
                                                                               C HAPTER 1 7 / Heart Rate Variability  389
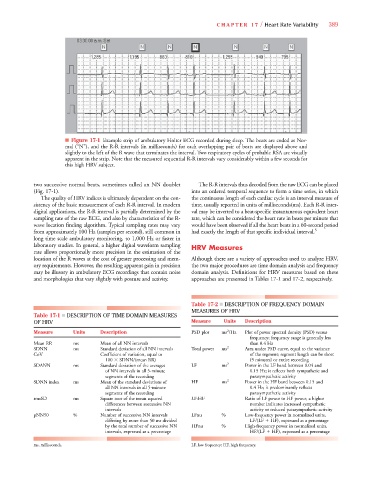
                             ■ Figure 17-1 Example strip of ambulatory Holter ECG recorded during sleep. The beats are coded as Nor-
                             mal (“N”), and the R-R intervals (in milliseconds) for each overlapping pair of beats are displayed above and
                             slightly to the left of the R wave that terminates the interval. Two respiratory cycles of probable RSA are visually
                             apparent in the strip. Note that the measured sequential R-R intervals vary considerably within a few seconds for
                             this high HRV subject.
                   two successive normal beats, sometimes called an NN doublet  The R-R intervals thus decoded from the raw ECG can be placed
                   (Fig. 17-1).                                        into an ordered temporal sequence to form a time series, in which
                     The quality of HRV indices is ultimately dependent on the con-  the continuous length of each cardiac cycle is an interval measure of
                   sistency of the basic measurement of each R-R interval. In modern  time, usually reported in units of milliseconds(ms). Each R-R inter-
                   digital applications, the R-R interval is partially determined by the  val may be inverted to a beat-specific instantaneous equivalent heart
                   sampling rate of the raw ECG, and also by characteristics of the R-  rate, which can be considered the heart rate in beats per minute that
                   wave location finding algorithm. Typical sampling rates may vary  would have been observed if all the heart beats in a 60-second period
                   from approximately 100 Hz (samples per second), still common in  had exactly the length of that specific individual interval. 5
                   long time scale ambulatory monitoring, to 1,000 Hz or faster in
                   laboratory studies. In general, a higher digital waveform sampling  HRV Measures
                   rate allows proportionally more precision in the estimation of the
                   location of the R waves at the cost of greater processing and mem-  Although there are a variety of approaches used to analyze HRV,
                   ory requirements. However, the resulting apparent gain in precision  the two major procedures are time domain analysis and frequency
                   may be illusory in ambulatory ECG recordings that contain noise  domain analysis. Definitions for HRV measures based on these
                   and morphologies that vary slightly with posture and activity.  approaches are presented in Tables 17-1 and 17-2, respectively.
                                                                       Table 17-2 ■ DESCRIPTION OF FREQUENCY DOMAIN
                                                                       MEASURES OF HRV
                   Table 17-1 ■ DESCRIPTION OF TIME DOMAIN MEASURES
                   OF HRV                                              Measure   Units  Description
                                                                                  2
                   Measure      Units    Description                   PSD plot  ms /Hz  Plot of power spectral density (PSD) versus
                                                                                          frequency; frequency range is generally less
                   Mean RR      ms       Mean of all NN intervals                         than 0.4 Hz
                   SDNN         ms       Standard deviation of all NN intervals  Total power  ms 2  Area under PSD curve, equal to the variance
                   CoV                   Coefficient of variation, equal to                of the segment; segment length can be short
                                          100   SDNN/(mean RR)                            (5 minutes) or entire recording
                   SDANN        ms       Standard deviation of the averages   LF  ms 2  Power in the LF band between 0.04 and
                                          of NN intervals in all 5-minute                 0.15 Hz; it reflects both sympathetic and
                                          segments of the recording                       parasympathetic activity
                   SDNN index   ms       Mean of the standard deviations of   HF  ms 2  Power in the HF band between 0.15 and
                                          all NN intervals in all 5-minute                0.4 Hz; it predominantly reflects
                                          segments of the recording                       parasympathetic activity
                   rmsSD        ms       Square root of the mean squared   LF:HF        Ratio of LF power to HF power; a higher
                                          differences between successive NN               number indicates increased sympathetic
                                          intervals                                       activity or reduced parasympathetic activity
                   pNN50        %        Number of successive NN intervals   LFnu  %    Low-frequency power in normalized units,
                                          differing by more than 50 ms divided            LF/(LF 
 HF), expressed as a percentage
                                          by the total number of successive NN  HFnu  %  High-frequency power in normalized units,
                                          intervals, expressed as a percentage            HF/(LF 
 HF), expressed as a percentage
                   ms, milliseconds.                                   LF, low frequency; HF, high frequency.
   408   409   410   411   412   413   414   415   416   417   418