
Page 517 - Cardiac Nursing
P. 517
P
g
P
8 A
M
Apt
ara
93
e 4
93
10.
qxd
10.
0-5
p46
009
8:2
9/2
0
9/0
K34
K34
21_
0-c
LWB K34 0-c 21_ p46 0-5 10. qxd 0 9/0 9/2 009 0 0 8:2 8 A M P a a g e 4 93 Apt ara
LWBK340-c21_21_p460-510.qxd 09/09/2009 08:28 AM Page 493 Aptara
L L LWB
C HAPTER 2 1 / Hemodynamic Monitoring 493
Hg, while the CI increased there was no improvement in indi- Technical Aspects of Monitoring
cators of tissue perfusion. 96 Therefore, standard hemodynamic Components of a continuous monitoring system include the
indices may not be sensitive to changes in tissue oxygenation, fiberoptic PA catheter, the optical module, and the microprocessor.
#
#
and the use of global ( , , serum lactate, and or The fiberoptic catheter is a quadruple-lumen PA catheter with
) and regional indices (transcutaneous O 2 and CO 2 sat-
Scvo 2 fiberoptic channels running the length of the catheter. The optical
uration, near-infrared spectroscopy (NIRS) and sublingual module contains diodes that emit light pulses through one of the
microcirculation assessment) may offer additional targeted fiberoptic channels in the tip of the catheter. The second fiberop-
information. tic channel returns reflected light to a photodetector in the optical
module (reflected spectrometry). The amount of light reflected de-
pends on the amount of saturated Hgb, because oxygenated and
Global Indicators of Oxygen
Supply and Demand deoxygenated Hgb have different reflections. The light is relayed
electronically to the microprocessor, which interprets the light sig-
Oxygen delivery depends on the amount of O 2 in the blood and nal and determines the ratio between oxygenated and deoxy-
how much blood is delivered to the tissues (CO). The O 2 deliv- genated blood. The is based on this ratio.
#
#
ery ( ) and O 2 consumption ( ) equations are outlined in
Table 21-11. An understanding of the factors that affect and Indications
#
g
g
is important to guide therapeutic decision, although the use Continuous monitoring has been recommended for moni-
Vo 2 # #
of absolute and values as endpoints for resuscitation has toring and as an outcome measure in patients with sepsis/septic
not been found to improve outcomes. shock, cardiac surgery, complicated MI (i.e., cardiogenic shock),
or patients with respiratory failure requiring PEEP. monitor-
ing is also recommended in the absence of hypotension when
Mixed Venous Oxygen Saturation shock is suspected by history and physical examination. 166
Although CO provides important information about the capacity Clinical Application
of the cardiopulmonary system to deliver O 2 to the tissues, it does
not necessarily depict the adequacy of O 2 supply at the tissue The normally ranges from 70% to 75%, which is associated
level. The , which is a global measure of the balance between with a of 40 mm Hg. An of less than 40% is usually
#
total body O 2 delivery and consumption, 431 is affected by factors accompanied by anaerobic metabolism, and an between
#
that affect O 2 delivery (CO, Hb, Sa o2 ) and consumption ( ) as 40% and 60% indicates inadequate or excessive O 2 demand.
described by the following equation: In response to increased O 2 demand, the body either increases
# CO to deliver more O 2 or increases the extraction of O 2 from the
blood. Although the reflects the O 2 balance for the entire
Vo 2
Svo 2 Sa O2 a 1.36 Hgb b body, it does not provide information on the adequacy of oxy-
CO
genation for individual organs.
The assumption is that if the Hgb and Sa o2 are not changing; When the Sa o2 is maintained near 100%, there is a strong re-
the change in reflects a change in CO. However, a decreased lationship between the and the O 2 extraction ratio (O 2 ER),
#
may also be caused by arterial hypoxemia, increased , or as defined by the equation:
Svo 2
a decreased Hgb; and in patients with severe HF (EF 30%) the 1 O 2 ER.
is not an adequate indicator of changes in CO. 432 Con- Svo 2
Svo 2
versely, in septic shock an increased may indicate inadequate Increased O 2 extraction decreases Hgb saturation, which is re-
O 2 utilization. 431 flected as a decrease in . In general, as long as O 2 delivery is
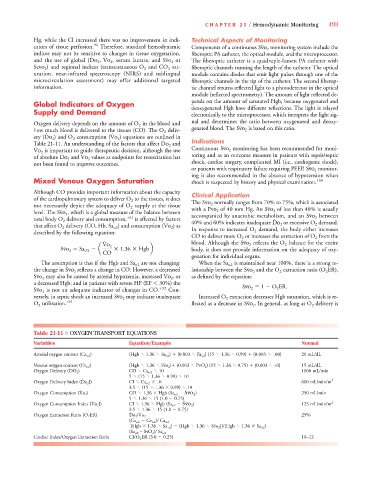
Table 21-11 ■ OXYGEN TRANSPORT EQUATIONS
Variables Equation/Example Normal
Arterial oxygen content (Ca o2 ) (Hgb 1.36 Sa o2 )
(0.003 Pa o2 ) (15 1.36 0.99)
(0.003 100) 20 mL/dL
Venous oxygen content (Cv o2 ) (Hgb 1.36 Svo 2 )
(0.003 PvO 2 ) (15 1.36 0.75)
(0.003 40) 15 mL/dL
#
Oxygen Delivery ( ) CO Ca o2 10 1000 mL/min
# 5 (15 1.36 0.99) 10
Oxygen Delivery Index ( ) CI Ca o2 10 600 mL/min/m 2
# 3.5 (15 1.36 0.99) 10
Oxygen Consumption ( ) CO 1.36 Hgb (Sa o2 Svo 2 ) 250 mL/min
# 5 1.36 15 (1.0 0.75)
Oxygen Consumption Index ( ) CI 1.36 Hgb (Sa o2 Svo 2 ) 125 mL/min/m 2
3.5 1.36 15 (1.0 0.75)
#
#
Oxygen Extraction Ratio (O 2 ER) 2 /Vo 2 25%
(Ca o2 Cv o2 )/ Ca o2
)]/(Hgb 1.36 Sa o2 )
[(Hgb 1.36 Sa o2 ) (Hgb 1.36 Svo 2
(Sa o2 – 2 )/ Sa o2
Cardiac Index/Oxygen Extraction Ratio CI/O 2 ER (3.0 0.25) 10–12