
Page 514 - Cardiac Nursing
P. 514
g
e 4
ara
p46
Apt
P
M
P
90
90
9/2
9/0
009
8 A
8:2
10.
0-5
10.
0
qxd
L L LWB
LWB K34 0-c 21_ p46 0-5 10. qxd 0 9/0 9/2 009 0 0 8:2 8 A M P a a g e 4 90 Apt ara
K34
K34
LWBK340-c21_21_p460-510.qxd 09/09/2009 08:28 AM Page 490 Aptara
21_
0-c
490 P A R T III / Assessment of Heart Disease
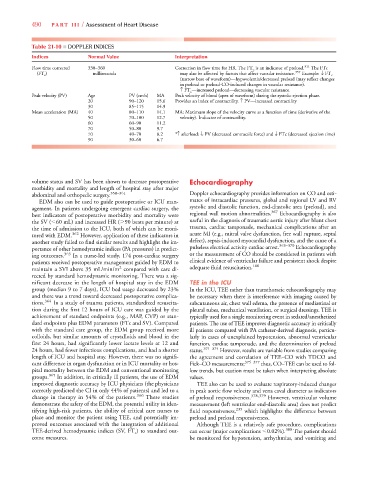
Table 21-10 ■ DOPPLER INDICES
Indices Normal Value Interpretation
Flow time corrected 330–360 Correction in flow time for HR. The FT c is an indicator of preload. 311 The FTc
(FT c ) milliseconds may also be affected by factors that affect vascular resistance. 357 Example: ↓ FT c
(narrow base of waveform)—hypovolemia/decreased preload (may reflect changes
in preload or preload-CO-induced changes in vascular resistance).
↑ FT c —increased preload—decreasing vascular resistance.
Peak velocity (PV) Age PV (cm/s) MA Peak velocity of blood (apex of waveform) during the systolic ejection phase.
20 90–120 15.6 Provides an index of contractility. ↑ PV—increased contractility
30 85–115 14.9
Mean acceleration (MA) 40 80–110 14.1 MA: Maximum slope of the velocity curve as a function of time (derivative of the
50 70–100 12.7 velocity). Indicator of contractility.
60 60–90 11.2
70 50–80 9.7
80 40–70 8.2 *↑ afterload: ↓ PV (decreased contractile force) and ↓ FTc (decreased ejection time)
90 30–60 6.7
volume status and SV has been shown to decrease postoperative Echocardiography
morbidity and mortality and length of hospital stay after major
abdominal and orthopedic surgery. 358–361 Doppler echocardiography provides information on CO and esti-
EDM also can be used to guide postoperative or ICU man- mates of intracardiac pressures, global and regional LV and RV
agement. In patients undergoing emergent cardiac surgery, the systolic and diastolic function, end-diastolic area (preload), and
367
best indicators of postoperative morbidity and mortality were regional wall motion abnormalities. Echocardiography is also
the SV ( 60 mL) and increased HR ( 90 beats per minute) at useful in the diagnosis of traumatic aortic injury after blunt chest
the time of admission to the ICU, both of which can be moni- trauma, cardiac tamponade, mechanical complications after an
tored with EDM. 362 However, application of these indicators in acute MI (e.g., mitral valve dysfunction, free wall rupture, septal
another study failed to find similar results and highlight the im- defect), sepsis-induced myocardial dysfunction, and the cause of a
368–370
portance of other hemodynamic indices (PA pressures) in predict- pulseless electrical activity cardiac arrest. Echocardiography
ing outcomes. 363 In a nurse-led study, 174 post-cardiac surgery or the measurement of CO should be considered in patients with
patients received postoperative management guided by EDM to clinical evidence of ventricular failure and persistent shock despite
166
2
maintain a SVI above 35 mL/min/m compared with care di- adequate fluid resuscitation.
rected by standard hemodynamic monitoring. There was a sig-
nificant decrease in the length of hospital stay in the EDM TEE in the ICU
group (median 9 to 7 days), ICU bed usage decreased by 23% In the ICU, TEE rather than transthoracic echocardiography may
and there was a trend toward decreased postoperative complica- be necessary when there is interference with imaging caused by
tions. 364 In a study of trauma patients, standardized resuscita- subcutaneous air, chest wall edema, the presence of mediastinal or
tion during the first 12 hours of ICU care was guided by the pleural tubes, mechanical ventilation, or surgical dressings. TEE is
achievement of standard endpoints (e.g., MAP, CVP) or stan- typically used for a single monitoring event in sedated/anesthetized
dard endpoints plus EDM parameters (FTc and SV). Compared patients. The use of TEE improves diagnostic accuracy in critically
with the standard care group, the EDM group received more ill patients compared with PA catheter-derived diagnosis, particu-
colloids, but similar amounts of crystalloids and blood in the larly in cases of unexplained hypotension, abnormal ventricular
first 24 hours, had significantly lower lactate levels at 12 and function, cardiac tamponade, and the determination of preload
24 hours, had fewer infectious complications, and had a shorter status. 371–374 However, results are variable from studies comparing
length of ICU and hospital stay. However, there was no signifi- the agreement and correlation of TEE–CO with TDCO and
cant difference in organ dysfunction or in ICU mortality or hos- Fick–CO measurements; 375–377 thus, CO–TEE can be used to fol-
pital mortality between the EDM and conventional monitoring low trends, but caution must be taken when interpreting absolute
groups. 365 In addition, in critically ill patients, the use of EDM values.
improved diagnostic accuracy by ICU physicians (the physicians TEE also can be used to evaluate respiratory-induced changes
correctly predicted the CI in only 44% of patients) and led to a in peak aortic flow velocity and vena caval diameter as indicators
change in therapy in 54% of the patients. 366 These studies of preload responsiveness. 378,379 However, ventricular volume
demonstrate the safety of the EDM, the potential utility in iden- measurement (left ventricular end-diastolic area) does not predict
tifying high-risk patients, the ability of critical care nurses to fluid responsiveness, 235 which highlights the difference between
place and monitor the patient using TEE, and potentially im- preload and preload responsiveness.
proved outcomes associated with the integration of additional Although TEE is a relatively safe procedure, complications
TEE-derived hemodynamic indices (SV, FT c ) to standard out- can occur (major complications 0.02%). 380 The patient should
come measures. be monitored for hypotension, arrhythmias, and vomiting and