
Page 513 - Cardiac Nursing
P. 513
9/2
9/2
9/0
0
9/0
0
8:2
0
009
009
0-5
10.
0-5
p46
p46
qxd
0
qxd
10.
10.
8:2
89
89
e 4
g
e 4
ara
ara
Apt
89
Apt
M
P
M
8 A
8 A
a
g
a
P
P
LWB
K34
LWBK340-c21_21_p460-510.qxd 09/09/2009 08:28 AM Page 489 Aptara
L L LWB
0-c
0-c
K34
K34
21_
21_
C HAPTER 2 1 / Hemodynamic Monitoring 489
7 mL/kg and is generally greater than 10 mL/kg with cardiogenic
and permeability pulmonary edema. 354 The EVLW may have prog-
nostic implications; 355 however, results are equivocal on whether it
aids in the differential diagnosis of cardiogenic versus permeability
pulmonary edema. There is no current research regarding the use of
EVLW to guide fluid therapy and EVLW cannot be measured us-
ing TPTD in patients who have a large pulmonary vascular ob-
struction, focal lung injury, or a lung resection.
A
Limitations of TPID Method
A decrease in the accuracy of TPID measurements may occur with
any condition that alters the transfer of the indicator across the heart
and lungs (e.g., intracardiac shunts, aortic aneurysm/stenosis, pneu-
monectomy, and pulmonary embolism), arrhythmias, rapidly chang-
ing temperature, and during extracorporeal circulation or intra-aortic
balloon pump. A relative contraindication to pulse contour analysis
is the presence an extremely damped arterial waveform. 350 Of inter-
est, in a study of LiDCO, 68% of the catheters were underdamped;
however, this did not affect the relationship between the continuous
LiDCO and intermittent CO measurements. 356 Similar research is
needed on PiCCO and the FloTrac systems.
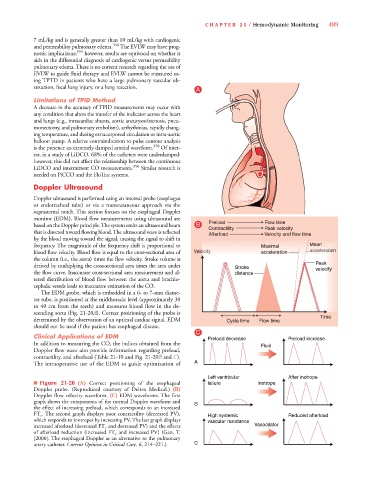
Doppler Ultrasound
Doppler ultrasound is performed using an internal probe (esophagus
or endotracheal tube) or via a transcutaneous approach via the
suprasternal notch. This section focuses on the esophageal Doppler
monitor (EDM). Blood flow measurements using ultrasound are
based on the Doppler principle. The system emits an ultrasound beam B Preload Flow time
Contractility Peak velocity
that is directed toward flowing blood. The ultrasound wave is reflected
Afterload Velocity and flow time
by the blood moving toward the signal, causing the signal to shift in
Mean
Mean
Mean
Mean
Mean
Mean
M M M Mean
Mean
Mean
frequency. The magnitude of the frequency shift is proportional to Maximal l l l Mean
Maximal
M M M Maximal
Maximal
i i i
Maximal
Maximal
Maximal
Maximal
Maximal
Maximal
ati
ati
atio
ati
at
at
at
atio
acceler
acceler
acceler
acceler
acceler
acceler
acceler
acceler
acceleratio
at
at
at
at
acceler
acceler
acceler
acceler
ocity
ocity
ocity
ocity
ocity
ocity
ocity
ocity
ty
it
oc
ocity
ation
ation
ation
ation
ation
ation
i ti ti ti
ation
ation
ation
l l l l
acceler
acceler
acceler
blood flow velocity. Blood flow is equal to the cross-sectional area of Velo iitocity y y y acceleration acceler ati o o o o o o o o n n n n n n n n n n
acceler
acceler
acceler
acceler
acceler
acceler
the column (i.e., the aorta) times the flow velocity. Stroke volume is
Peak k k k k k
derived by multiplying the cross-sectional area times the area under Stroke
c
c
c
c
c
c
i
t
t
t
t
i
i
t
t
the flow curve. Inaccurate cross-sectional area measurement and al- distance veloc y y y y y y y y y y y
tered distribution of blood flow between the aorta and brachio-
cephalic vessels leads to inaccurate estimation of the CO.
The EDM probe, which is embedded in a 6- to 7-mm diame-
ter tube, is positioned at the midthoracic level (approximately 30
to 40 cm from the teeth) and measures blood flow in the de-
0
0
scending aorta (Fig. 21-20A). Correct positioning of the probe is
Time
determined by the observation of an optimal cardiac signal. EDM Cycle time Flow time
should not be used if the patient has esophageal disease.
C
Clinical Applications of EDM Preload decrease Preload increase
In addition to measuring the CO, the indices obtained from the
Fluid
Doppler flow wave also provide information regarding preload,
contractility, and afterload (Table 21-10 and Fig. 21-20B and C).
C
C
The intraoperative use of the EDM to guide optimization of A
Left ventricular After inotrope
■ Figure 21-20 (A) Correct positioning of the esophageal failure Inotrope
Doppler probe. (Reproduced courtesy of Deltex Medical.) (B)
Doppler flow velocity waveform. (C) EDM waveforms. The first
graph shows the components of the normal Doppler waveform and B
the effect of increasing preload, which corresponds to an increased
FT c . The second graph displays poor contractility (decreased PV), High systemic Reduced afterload
which responds to inotropes by increasing PV. The last graph displays vascular resistance
increased afterload (decreased FT c and decreased PV) and the effects Vasodilator
of afterload reduction (increased FT c and increased PV) (Gan, T.
[2000]. The esophageal Doppler as an alternative to the pulmonary
artery catheter. Current Opinion in Critical Care, 6, 214–221.)6 6 C