
Page 518 - Cardiac Nursing
P. 518
M
P
8:2
8 A
P
94
94
g
e 4
10.
10.
0-5
p46
qxd
9/2
009
0
9/0
K34
K34
21_
0-c
LWBK340-c21_21_p460-510.qxd 09/09/2009 08:28 AM Page 494 Aptara
ara
Apt
L L LWB
LWB K34 0-c 21_ p46 0-5 10. qxd 0 9/0 9/2 009 0 0 8:2 8 A M P a a g e 4 94 Apt ara
494 P A R T III / Assessment of Heart Disease
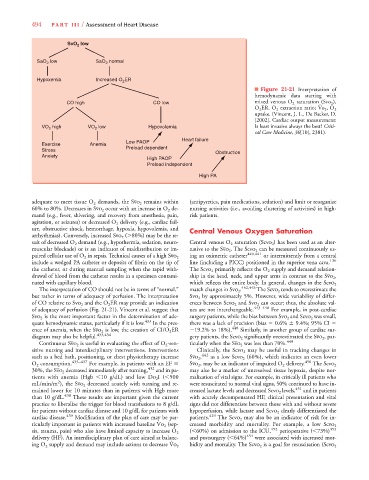
SvO low
2
SaO low SaO normal
2
2
Hypoxemia Increased O ER
2
■ Figure 21-21 Interpretation of
hemodynamic data starting with
#
CO high CO low mixed venous O 2 saturation (Svo 2 ),
O 2 ER, O 2 extraction ratio; 2 , O 2
uptake. (Vincent, J. L., De Backer, D.
[2002]. Cardiac output measurement:
VO high VO low Hypovolemia Is least invasive always the best? Criti-
2
2
cal Care Medicine, 30[10], 2381).
Heart failure
Low PAOP
Exercise Anemia
Stress Preload dependent
Obstruction
Anxiety
High PAOP
Preload independent
High PA
adequate to meet tissue O 2 demands, the 2 remains within (antipyretics, pain medications, sedation) and limit or reorganize
60% to 80%. Decreases in 2 occur with an increase in O 2 de- nursing activities (i.e., avoiding clustering of activities) in high-
mand (e.g., fever, shivering, and recovery from anesthesia, pain, risk patients.
agitation, or seizures) or decreased O 2 delivery (e.g., cardiac fail-
ure, obstructive shock, hemorrhage, hypoxia, hypovolemia, and Central Venous Oxygen Saturation
arrhythmias). Conversely, increased ( 80%) may be the re-
sult of decreased O 2 demand (e.g., hypothermia, sedation, neuro- Central venous O 2 saturation ( 2 ) has been used as an alter-
muscular blockade) or is an indicator of maldistribution or im- native to the . The can be measured continuously us-
ing an oximetric catheter 440,441 or intermittently from a central
paired cellular use of O 2 in sepsis. Technical causes of a high Svo 2
include a wedged PA catheter or deposits of fibrin on the tip of line (including a PICC) positioned in the superior vena cava. 130
the catheter, or during manual sampling when the rapid with- The primarily reflects the O 2 supply and demand relation-
drawal of blood from the catheter results in a specimen contami- ship in the head, neck, and upper arms in contrast to the ,
nated with capillary blood. which reflects the entire body. In general, changes in the Scvo 2
The interpretation of CO should not be in terms of “normal,” match changes in . 442,443 The 2 tends to overestimate the
but rather in terms of adequacy of perfusion. The interpretation Svo 2 by approximately 5%. However, wide variability of differ-
of CO relative to 2 and the O 2 ER may provide an indication ences between 2 and 2 can occur; thus, the absolute val-
of adequacy of perfusion (Fig. 21-21). Vincent et al. suggest that ues are not interchangeable. 443–448 For example, in post-cardiac
is the most important factor in the determination of ade- surgery patients, while the bias between and was small,
Svo 2
quate hemodynamic status, particularly if it is low. 433 In the pres- there was a lack of precision (bias 0.6% 9.4%; 95% CI
ence of anemia, when the 2 is low, the creation of CI/O 2 ER 19.2% to 18%). 448 Similarly, in another group of cardiac sur-
diagram may also be helpful. 433,434 gery patients, the significantly overestimated the , par-
Continuous is useful in evaluating the effect of O 2 -sen- ticularly when the was less than 70%. 449
sitive nursing and interdisciplinary interventions. Interventions Clinically, the may be useful in tracking changes in
such as a bed bath, positioning, or chest physiotherapy increase Svo , 2 442 as a low 2 (60%), which indicates an even lower
O 2 consumption. 435–437 For example, in patients with an EF Svo 2 , may be an indicator of impaired O 2 delivery. 450 The Scvo 2
30%, the decreased immediately after turning, 432 and in pa- may also be a marker of unresolved tissue hypoxia, despite nor-
#
tients with anemia (Hgb 10 g/dL) and low ( 500 malization of vital signs. For example, in critically ill patients who
2
mL/min/m ), the decreased acutely with turning and re- were resuscitated to normal vital signs, 50% continued to have in-
mained lower for 10 minutes than in patients with Hgb more creased lactate levels and decreased 2 levels, 451 and in patients
than 10 g/dL. 438 These results are important given the current with acutely decompensated HF, clinical presentation and vital
practice to liberalize the trigger for blood transfusions to 8 g/dL signs did not differentiate between those with and without severe
for patients without cardiac disease and 10 g/dL for patients with hypoperfusion, while lactate and clearly differentiated the
cardiac disease. 439 Modification of the plan of care may be par- patients. 429 The may also be an indicator of risk for in-
y
y
#
ticularly important in patients with increased baseline (sep- creased morbidity and mortality. For example, a low Scvo 2
( 60%) on admission to the ICU, 452 perioperative ( 73%) 453
sis, trauma, pain) who also have limited capacity to increase O 2
delivery (HF). An interdisciplinary plan of care aimed at balanc- and postsurgery ( 64%) 454 were associated with increased mor-
#
bidity and mortality. The
ing O 2 supply and demand may include actions to decrease Vo 2 is a goal for resuscitation (Scvo 2