
Page 62 - Cardiac Nursing
P. 62
92806_c01.qxd 11/21/11 10:30 AM Page 38
38 PA R T I / Anatomy and Physiology
pressure increases may cause slight increases in atrial and aortic
pressures recorded during this period.
During the brief time when both mitral and aortic valves are
closed, there are no actual changes in ventricular volume because
no blood is flowing into or out of the ventricle. The ventricle
changes shape during this period. The apparent increase in ven-
tricular volume recorded on the ventricular volume curve in Fig-
ure 1-38 occurs when ventricular volume is calculated based on
ventricular circumference.
The isovolumic or isovolumetric period is also termed the iso-
metric phase of ventricular contraction because tension is increas-
ing rapidly, but the muscle fibers do not shorten much until they
overcome the afterload of aortic pressure. Muscle contraction is
not completely isometric, however, because the ventricles change
dimensions.
Rapid Ventricular Ejection (Period b, Fig. 1-38). Ven-
tricular muscle contraction continues, and the aortic valve re-
mains open as long as left ventricular pressure exceeds aortic pres-
sure. The aorta and left ventricle are essentially a common cavity
at this time. Ventricular pressure continues to increase rapidly
during the initial part of this period, and then rises less rapidly to
approximately the systolic pressure (120 mm Hg in the figure)
later during this period.
Ventricular volume decreases rapidly during ventricular ejec-
tion; two thirds or more of the stroke volume is ejected during this
approximately 0.09-second period (Table 1-6). Aortic flow
reaches peak velocity early in the rapid ejection period before the
point of maximal ventricular pressure. Aortic pressure may actu-
ally slightly exceed ventricular pressure during the latter period of
rapid ventricular ejection, but blood continues to flow into the
aorta because of the forward momentum of the blood. Much of
the stroke volume is accommodated in the elastic proximal aorta.
The left atrium is relaxed at this time. Atrial pressure slowly be-
gins to increase as blood from the lungs accumulates in the
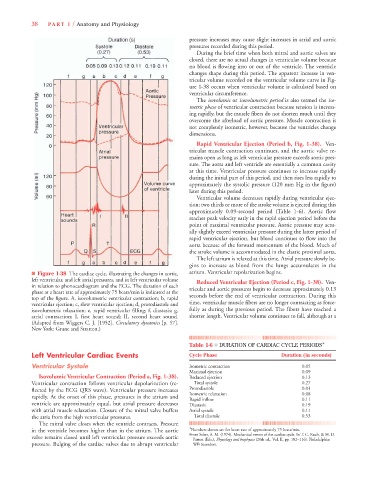
■ Figure 1-38 The cardiac cycle, illustrating the changes in aortic, atrium. Ventricular repolarization begins.
left ventricular, and left atrial pressures, and in left ventricular volume Reduced Ventricular Ejection (Period c, Fig. 1-38). Ven-
in relation to phonocardiogram and the ECG. The duration of each tricular and aortic pressures begin to decrease approximately 0.13
phase at a heart rate of approximately 75 beats/min is indicated at the
top of the figure. A, isovolumetric ventricular contraction; b, rapid seconds before the end of ventricular contraction. During this
ventricular ejection; c, slow ventricular ejection; d, protodiastole and time, ventricular muscle fibers are no longer contracting as force-
isovolumetric relaxation; e, rapid ventricular filling; f, diastasis; g, fully as during the previous period. The fibers have reached a
atrial contraction; I, first heart sound; II, second heart sound. shorter length. Ventricular volume continues to fall, although at a
(Adapted from Wiggers C. J. [1952]. Circulatory dynamics [p. 57].
New York: Grune and Stratton.)
Table 1-6 ■ DURATION OF CARDIAC CYCLE PERIODS*
Left Ventricular Cardiac Events Cycle Phase Duration (in seconds)
Ventricular Systole Isometric contraction 0.05
Maximal ejection 0.09
Isovolumic Ventricular Contraction (Period a, Fig. 1-38). Reduced ejection 0.13
Ventricular contraction follows ventricular depolarization (re- Total systole 0.27
flected by the ECG QRS wave). Ventricular pressure increases Protodiastole 0.04
rapidly. At the onset of this phase, pressures in the atrium and Isometric relaxation 0.08
0.11
Rapid inflow
ventricle are approximately equal, but atrial pressure decreases Diastasis 0.19
with atrial muscle relaxation. Closure of the mitral valve buffers Atrial systole 0.11
the atria from the high ventricular pressures. Total diastole 0.53
The mitral valve closes when the ventricle contracts. Pressure
in the ventricle becomes higher than in the atrium. The aortic *Numbers shown are for heart rate of approximately 75 beats/min.
From Scher, A. M. (1974). Mechanical events of the cardiac cycle. In T. C. Ruch, & H. D.
valve remains closed until left ventricular pressure exceeds aortic
Patton (Eds.), Physiology and biophysics (20th ed., Vol. II, pp. 102–116). Philadelphia:
pressure. Bulging of the cardiac valves due to abrupt ventricular WB Saunders.