
Page 60 - Cardiac Nursing
P. 60
92806_c01.qxd 11/21/11 10:30 AM Page 36
36 PA R T I / Anatomy and Physiology
Each cardiac contraction involves ionic movement across cell tension–time index are often used to estimate MV ˙ O 2 . The
membranes. The oxygen required for electrical depolarization and pressure–rate product is calculated by multiplying the heart rate
repolarization is small, 61 accounted for by the cycling of pumps by the systolic or mean arterial pressure and dividing by 100. The
that maintain sodium, potassium, and other ionic distributions. tension–time index (more appropriately should be called the
In addition to these two fairly constant and low requirements pressure–time index) is calculated by multiplying the area under
for oxygen, factors related to activity and the state of the heart that the left ventricular pressure curve by heart rate. Both pressure–rate
determine how much oxygen the heart needs. These factors, product and tension–time index take heart rate (a major MV ˙ O 2
which include intramyocardial tension, heart rate, shortening, determinant) into account. Because pressure, not tension, is in-
and contractile state, constitute the major determinants of my- cluded in these indicators, the other factors in the Laplace equa-
ocardial oxygen consumption (MV ˙ O 2 ). tion (i.e., ventricular cavity radius, ventricular wall thickness)
must be constant if these indices are to accurately predict MV ˙ O 2 .
Intramyocardial Tension
The law of Laplace is used to calculate intramyocardial tension. Myocardial Oxygen Supply
This law states that intramyocardial tension is proportional to the
internal pressure within the ventricular cavity times the ventricu- Control of Coronary Blood Flow
lar cavity radius; it is inversely proportional to the ventricular wall Flow of blood in the coronary circulation is, as in all vascular beds,
thickness. An increase in left ventricular afterload causes the left proportional to the perfusion pressure and inversely proportional
ventricle to develop more pressure during the systolic period, to the resistance of the bed. Resistance in the coronary bed is al-
thereby increasing intramyocardial tension and oxygen consump- tered by compression on it during systole and by metabolic, neu-
tion. An increase in the preload or filling pressures of the left ven- ral, and hormonal factors. Coronary artery disease can impose sig-
tricle increases tension because both internal pressure and the ra- nificant resistance.
dius of the ventricular cavity are increased and the thickness is The pressure difference that drives cardiac perfusion is the gra-
decreased. Again, MV ˙ O 2 is increased. dient between aortic pressure and right atrial pressure because
most of the coronary perfusion returns to the right atrium. Be-
Heart Rate cause the heart develops its own perfusion pressure, a fall in aor-
Increased heart rate (at the same preload and afterload) increases tic pressure can reduce coronary perfusion, which in turn may fur-
MV ˙ O 2 . Each beat represents the generation of tension by the my- ther decrease cardiac function and pressure development. A cycle
ocardium. of deterioration may result. The coronary circulation, however, is
autoregulated. This means that changes in the perfusion pressure
Shortening over a range of pressures (approximately 60 to 180 mm Hg) make
In an isotonic twitch, there is a component of the oxygen con- little difference in the amount of blood flowing to the heart if the
sumption that is proportional to the amount of shortening by a other factors influencing perfusion are held constant.
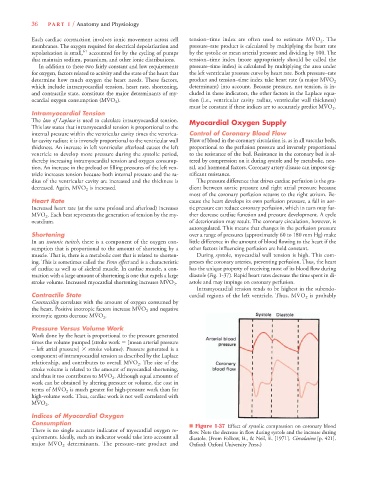
muscle. That is, there is a metabolic cost that is related to shorten- During systole, myocardial wall tension is high. This com-
ing. This is sometimes called the Fenn effect and is a characteristic presses the coronary arteries, preventing perfusion. Thus, the heart
of cardiac as well as of skeletal muscle. In cardiac muscle, a con- has the unique property of receiving most of its blood flow during
traction with a large amount of shortening is one that expels a large diastole (Fig. 1-37). Rapid heart rates decrease the time spent in di-
stroke volume. Increased myocardial shortening increases MV ˙ O 2 . astole and may impinge on coronary perfusion.
Intramyocardial tension tends to be highest in the subendo-
Contractile State cardial regions of the left ventricle. Thus, MV ˙ O 2 is probably
Contractility correlates with the amount of oxygen consumed by
the heart. Positive inotropic factors increase MV ˙ O 2 and negative
inotropic agents decrease MV ˙ O 2 .
Pressure Versus Volume Work
Work done by the heart is proportional to the pressure generated
times the volume pumped (stroke work [mean arterial pressure
– left atrial pressure] stroke volume). Pressure generated is a
component of intramyocardial tension as described by the Laplace
relationship, and contributes to overall MV ˙ O 2 . The size of the
stroke volume is related to the amount of myocardial shortening,
and thus it too contributes to MV ˙ O 2 . Although equal amounts of
work can be obtained by altering pressure or volume, the cost in
terms of MV ˙ O 2 is much greater for high-pressure work than for
high-volume work. Thus, cardiac work is not well correlated with
MV ˙ O 2 .
Indices of Myocardial Oxygen
Consumption ■ Figure 1-37 Effect of systolic compression on coronary blood
There is no single accurate indicator of myocardial oxygen re- flow. Note the decrease in flow during systole and the increase during
quirements. Ideally, such an indicator would take into account all diastole. (From Folkow, B., & Neil, E. [1971]. Circulation [p. 421].
major MV ˙ O 2 determinants. The pressure–rate product and Oxford: Oxford University Press.)