
Page 778 - Cardiac Nursing
P. 778
1
1
009
2
009
A
A
A
2:0
4 A
6
qx
d
68.
p7
3-7
/
0
0
3
0
ara
32_
Apt
5
4
L L LWB
LWB K34 0-c 32_ p7 5 3-7 68. qx d 3 0 / 0 6 / / 2 009 1 2:0 4 A M Pa g g e 7 5 4 Apt ara
LWBK340-c32_32_p7553-768.qxd 30/06/2009 12:04 AM Page 754 Aptara
0-c
K34
A
A
A
A
A
A
Pa
e 7
M
A
754 PA R T V / Health Promotion and Disease Prevention
Cardiovascular 10000
Disease
Coronary Heart
Disease 1000
Cancer
Cerebrovascular Death Rate Per 100,000 100
Disease
Pulmonary African-American Women
Disease White Men 10 White Women
African-American Men
Pneumonia/Flu African-American Men
White Women White Men
African-American Women
Diabetes 1
35–44 45–54 55–64 65–74 75–84 85+
0 250 500 750 1000 1250 1500 Age
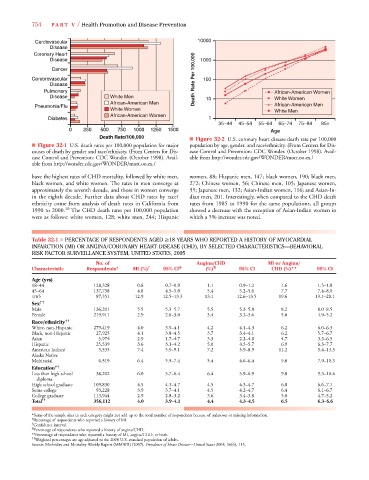
Death Rate/100,000 ■ Figure 32-2 U.S. coronary heart disease death rate per 100,000
■ Figure 32-1 U.S. death rates per 100,000 population for major population by age, gender, and race/ethnicity. (From Centers for Dis-
causes of death by gender and race/ethnicity. (From Centers for Dis- ease Control and Prevention: CDC Wonder. (October 1998). Avail-
ease Control and Prevention: CDC Wonder. (October 1998). Avail- able from http://wonder.cdc.gov/WONDER/mort.oo.ex./
able from http://wonder.cdc.gov/WONDER/mort.oo.ex./
have the highest rates of CHD mortality, followed by white men, women, 88; Hispanic men, 147; black women, 190; black men,
black women, and white women. The rates in men converge at 272; Chinese women, 56; Chinese men, 105; Japanese women,
approximately the seventh decade, and those in women converge 55; Japanese men, 132; Asian-Indian women, 116; and Asian-In-
in the eighth decade. Further data about CHD rates by race/ dian men, 201. Interestingly, when compared to the CHD death
ethnicity come from analysis of death rates in California from rates from 1985 to 1990 for the same populations, all groups
1990 to 2000. 10 The CHD death rates per 100,000 population showed a decrease with the exception of Asian-Indian women in
were as follows: white women, 128; white men, 244; Hispanic which a 5% increase was noted.
Table 32-1 ■ PERCENTAGE OF RESPONDENTS AGED 18 YEARS WHO REPORTED A HISTORY OF MYOCARDIAL
INFARCTION (MI) OR ANGINA/CORONARY HEART DISEASE (CHD), BY SELECTED CHARACTERISTICS—BEHAVIORAL
RISK FACTOR SURVEILLANCE SYSTEM, UNITED STATES, 2005
No. of Angina/CHD MI or Angina/
Characteristic Respondents* MI (%) † 95% CI § (%) ¶ 95% CI CHD (%)** 95% CI
Age (yrs)
18–44 128,328 0.8 0.7–0.9 1.1 0.9–1.2 1.6 1.5–1.8
45–64 137,738 4.8 4.5–5.0 5.4 5.2–5.6 7.7 7.4–8.0
65 87,351 12.9 12.5–13.3 13.1 12.6–13.5 19.6 19.1–20.1
Sex ††
Male 136,201 5.5 5.3–5.7 5.5 5.3–5.8 8.2 8.0–8.5
Female 219,911 2.9 2.8–3.0 3.4 3.3–3.6 5.0 4.9–5.2
Race/ethnicity ††
White, non-Hispanic 279,419 4.0 3.9–4.1 4.2 4.1–4.3 6.2 6.0–6.3
Black, non-Hispanic 27,925 4.1 3.8–4.5 3.7 3.4–4.1 6.2 5.7–6.7
Asian 5,974 2.9 1.7–4.7 3.3 2.2–4.8 4.7 3.3–6.5
Hispanic 25,539 3.6 3.1–4.2 5.0 4.5–5.7 6.9 6.3–7.7
American Indian/ 5,535 7.4 5.9–9.1 7.2 5.9–8.9 11.2 9.4–13.3
Alaska Native
Multiracial 6,519 6.4 5.5–7.4 5.4 4.6–6.4 9.0 7.9–10.3
Education ††
Less than high school 38,202 6.0 5.7–6.4 6.4 5.9–6.9 9.8 9.3–10.4
diploma
High school graduate 109,830 4.5 4.3–4.7 4.5 4.3–4.7 6.8 6.6–7.1
Some college 93,228 3.9 3.7–4.1 4.5 4.2–4.7 6.4 6.1–6.7
College graduate 113,944 2.9 2.8–3.2 3.6 3.4–3.8 5.0 4.7–5.2
Total †† 356,112 4.0 3.9–4.1 4.4 4.3–4.5 6.5 6.3–6.6
*Sums of the sample sizes in each category might not add up to the total number of respondents because of unknown or missing information.
† Percentage of respondents who reported a history of MI.
§ Confidence interval.
¶ Percentage of respondents who reported a history of angina/CHD.
**Percentage of respondents who reported a history of MI, angina/CHD, or both.
†† Weighted percentages are age adjusted to the 2000 U.S. standard population of adults.
Source: Morbidity and Mortality Weekly Report (MMWR) (2007). Prevalence of Heart Disease—United States 2005, 56(6), 115.