Page 781 - Cardiac Nursing
P. 781

LWBK340-c32_p753-768.qxd  30/06/2009  12:04 AM  Page 757 Aptara


                                                                  C HAP TE R  32 / Coronary Heart Disease Risk Factors  757

                                                                                         Women
                                                                       Caucasian       African-American  Mexican-American
                                                                  80
                                                                  70

                                                                  60
                                                               Percent with high  blood pressure  50

                                                                  40
                                                                  30
                                                                  20
                                                                  10
                                                                  0
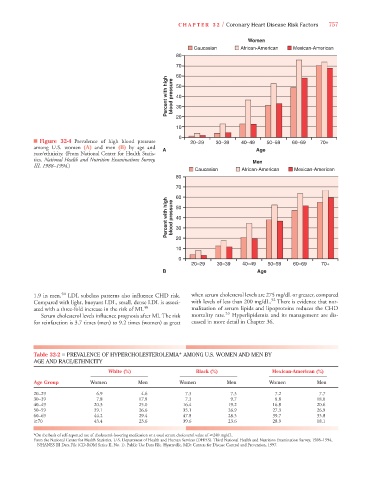
                   ■ Figure 32-4 Prevalence of high blood pressure    20–29    30–39   40–49   50–59    60–69    70+
                   among U.S. women  (A) and men (B) by age and  A                          Age
                   race/ethnicity. (From National Center for Health Statis-
                   tics. National Health and Nutrition Examinations Survey,                Men
                   III, 1988–1994.)
                                                                        Caucasian      African-American  Mexican-American
                                                                  80
                                                                  70
                                                                  60
                                                               Percent with high  blood pressure  50

                                                                  40
                                                                  30

                                                                  20
                                                                  10
                                                                  0
                                                                       20–29   30–39   40–49    50–59   60–69    70+
                                                             B                              Age


                   1.9 in men. 50  LDL subclass patterns also influence CHD risk.  when serum cholesterol levels are 275 mg/dL or greater, compared
                                                                                                 52
                   Compared with light, buoyant LDL, small, dense LDL is associ-  with levels of less than 200 mg/dL. There is evidence that nor-
                   ated with a three-fold increase in the risk of MI. 48  malization of serum lipids and lipoproteins reduces the CHD
                     Serum cholesterol levels influence prognosis after MI. The risk  mortality rate.  53  Hyperlipidemia and its management are dis-
                   for reinfarction is 3.7 times (men) to 9.2 times (women) as great  cussed in more detail in Chapter 36.


                   Table 32-2 ■ PREVALENCE OF HYPERCHOLESTEROLEMIA* AMONG U.S. WOMEN AND MEN BY
                   AGE AND RACE/ETHNICITY
                                           White (%)                    Black (%)                Mexican-American (%)
                   Age Group          Women          Men           Women          Men           Women           Men
                   20–29                6.9           4.6            7.3           7.3            7.2           7.7
                   30–39                7.8          17.8            7.3           9.7            8.8           18.0
                   40–49               20.3          25.0           16.4           19.2          16.8           20.6
                   50–59               39.1          26.6           35.1           26.9          27.3           26.9
                   60–69               44.2          29.4           47.8           28.3          39.7           33.8
                    70                 43.4          23.6           39.6           23.6          28.9           18.1

                   *On the basis of self-reported use of cholesterol-lowering medication or a total serum cholesterol value of  240 mg/dL.
                   From the National Center for Health Statistics, U.S. Department of Health and Human Services (DHHS). Third National Health and Nutrition Examination Survey, 1988–1994,
                    NHANES III Data File (CD-ROM Series II, No. 1). Public Use Data File. Hyattsville, MD: Centers for Disease Control and Prevention, 1997.
   776   777   778   779   780   781   782   783   784   785   786