
Page 87 - Cardiac Nursing
P. 87
0
0
0
xd
xd
6/3
009
009
0/2
6/3
0/2
04
2-0
04
p
p
2-0
q
q
q
68.
68.
1
3 A
p
3 A
e 6
e 6
p
r
r
ta
p
ta
3
3
5:3
1
5:3
Pa
g
g
g
Pa
Pa
LWBK340-c02_
LWB
LWB K34 0-c 02_ pp042-068.qxd 06/30/2009 15:33 Page 63 Aptara a a
02_
0-c
K34
C HAPTER 2 / Systemic and Pulmonary Circulation and Oxygen Delivery 63
porphyrin and iron. The molecule is composed of two and two 100
polypeptide chains, each with an iron-containingheme mole-
a
cule capable ofbinding oxygen. Theoretically, 1 g of Hgb is ca- O affinity
2
pable of transporting 1.39 mL of oxygen. However, some of the Normal O affinity
f
r
2
heme sites are in an alternate form (methemoglobin) that is not
capable of combining with oxygen. The maximum amount of
oxygen that can be transported is approximately 1.34 to 1.36 P CO 2
+
mL/g of Hgb (some authors suggest this number may be lower, O affinity H or pH
affinity
approximately 1.31 mL/g). 156 Hgb has a unique chemical struc- 50 2 2 Temperature
e
ture that accounts for the differences in the speed at which oxy- 2,3-DPG
P
gen binds with Hgb (affinity). Oxygen affinity increases as more
Hgb is saturated with oxygen, so that the affinity of the last heme
unit is greater than the first unit. This relationship explains the P P P 50
nonlinear curve represented in the oxyhemoglobin dissociation
(or equilibrium) curve. 138
0
Partial Pressure of Oxygen. Alveolar oxygen diffuses into 0 20 40 60 80 100 120
the pulmonary capillaries. The amount of oxygen transferred de- P P P (mm Hg)
O 2
pends on the mechanics of the ventilation–perfusion relationship
of the lungs and the amount of inspired oxygen. The majority 0 2 4 6 8 10 12 14 16
(97%) of the oxygen transportedby the blood is bound to Hgb. P P P (kPa)
O 2
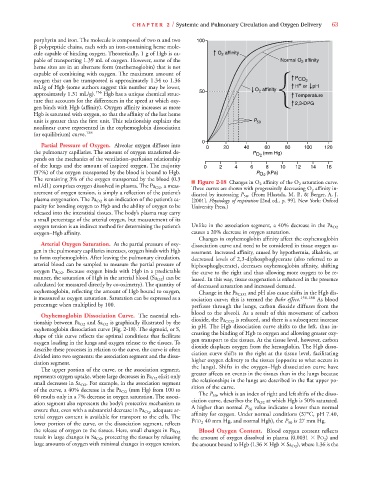
The remaining 3% of the oxygen transportedby the blood (0.3 ■ Figure 2-18 Changes in O 2 affinity of the O 2 saturation curve.
mL/dL) comprises oxygen dissolved in plasma. The Pa O2 , a meas- Three curves are shown with progressively decreasing O 2 affinity in-
urement of oxygen tension, is simply a reflection of the patient’s dicated by increasing P 50 . (From Hlastala, M. P., & Berger, A. J.
plasma oxygenation. The Pa O2 is an indication of the patient’s ca- [2001]. Physiology of respiration [2nd ed., p. 99]. New York: Oxford
pacity for bonding oxygen to Hgb and the ability of oxygen to be University Press.)
released into the interstitial tissues. The body’s plasma may carry
a small percentage of the arterial oxygen, but measurement of its
oxygen tension is an indirect methodfor determining the patient’s Unlike in the association segment, a 40% decrease in the Pa O2
oxygen–Hgb affinity. causes a 20% decrease in oxygen saturation.
Changes in oxyhemoglobin affinity affect the oxyhemoglobin
Arterial Oxygen Saturation. As the partialpressure of oxy- dissociation curve and need to be considered in tissue oxygen as-
gen in the pulmonary capillaries increases, oxygen binds with Hgb sessment. Increased affinity, caused by hypothermia, alkalosis, or
to form oxyhemoglobin. After leaving the pulmonary circulation, decreased levels of 2,3-diphosphoglycerate (also referred to as
arterialblood can be sampled to measure the partialpressure of biphosphoglycerate), decreases oxyhemoglobin affinity, shifting
oxygen Pa O2 . Because oxygen binds with Hgb in a predictable the curve to the right and thus allowing more oxygen to be re-
manner, the saturation of Hgb in the arterialblood (Sa O2 ) can be leased. In this way, tissue oxygenation is enhanced in the presence
calculated (or measureddirectly by co-oximetry). The quantity of of decreased saturation and increased demand.
oxyhemoglobin, reflecting the amount of Hgb bound to oxygen, Change in the Pa CO2 and pH also cause shifts in the Hgb dis-
is measured as oxygen saturation. Saturation can be expressed as a sociation curve; this is termed the Bohr effect. 156,188 As blood
percentage when multipliedby 100. perfuses through the lungs, carbon dioxide diffuses from the
blood to the alveoli. As a result of this movement of carbon
Oxyhemoglobin Dissociation Curve. The essential rela-
tionshipbetween Pa O2 and Sa O2 is graphically illustratedby the dioxide, the Pa CO2 is reduced, and there is a subsequent increase
oxyhemoglobin dissociation curve (Fig. 2-18). The sigmoid, or S, in pH. The Hgb dissociation curve shifts to the left, thus in-
shape of this curve reflects the optimal conditions that facilitate creasing the binding of Hgb to oxygen and allowing greater oxy-
oxygen loading in the lungs and oxygen release to the tissues. To gen transport to the tissues. At the tissue level, however, carbon
describe these processes in relation to the curve, the curve is often dioxide displaces oxygen from the hemoglobin. The Hgb disso-
divided into two segments: the association segment and the disso- ciation curve shifts to the right at the tissue level, facilitating
ciation segment. higher oxygen delivery to the tissues (opposite to what occurs in
The upper portion of the curve, or the association segment, the lungs). Shifts in the oxygen–Hgb dissociation curve have
represents oxygen uptake, where large decreases in Pa O2 elicit only greater affects on events in the tissues than in the lungs because
small decreases in Sa O2 . For example, in the association segment the relationships in the lungs are described in the flat upper po-
of the curve, a 40% decrease in the Pa O2 (mm Hg) from 100 to sition of the curve.
P P
60 results only in a 7% decrease in oxygen saturation. The associ- The P 50 , which is an index of right and left shifts of the disso-
ation segment also represents the body’s protective mechanism to ciation curve, describes the Pa O2 at which Hgb is 50% saturated.
P
, adequate ar- A higher than normal P 50 value indicates a lower than normal
ensure that, even with a substantialdecrease in Pa O 2 affinity for oxygen. Under normal conditions (37°C, pH 7.40,
terial oxygen content is available for transport to the cells. The
P P
lower portion of the curve, or the dissociation segment, reflects PCO 2 40 mm Hg, and normal Hgb), the P 50 is 27 mm Hg.
Blood Oxygen Content. Blood oxygen content reflects
the release of oxygen to the tissues. Here, small changes in Pa O2
result in large changes in Sa O2 , protecting the tissues by releasing the amount of oxygen dissolved in plasma (0.0031 PO 2 ) and
large amounts of oxygen with minimal changes in oxygen tension. the amount bound to Hgb (1.36 Hgb Sa O2 ), where 1.36 is the