
Page 195 - Color Atlas Of Pathophysiology (S Silbernagl Et Al, Thieme 2000)
P. 195
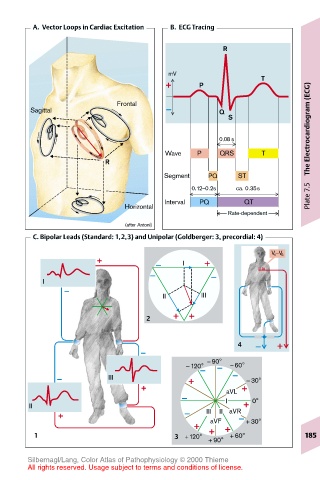
A.  Vector Loops in Cardiac Excitation  B.  ECG Tracing

                                                   R


                                       mV
                                                            T
                                              P
                           Frontal
        Sagittal                                  Q
                                                    S                  Electrocardiogram (ECG)

                                                  0.08 s
                                      Wave   P    QRS       T
                         R
                                                                       The
                                      Segment   PQ     ST
                                            0.12–0.2s  ca. 0.35s
                                      Interval  PQ      QT             Plate 7.5
                             Horizontal
                                                    Rate-dependent
                             (after Antoni)
        C. Bipolar Leads (Standard: 1,2,3) and Unipolar (Goldberger: 3, precordial: 4)

                                                              V 1 –V 6
                                          I
           I
                                      II      III

                                  2


                                                       4
                                                – 90°
                                           – 120°    – 60°
                         III                             – 30°
                                                    aVL
                                                    I     0°
        II
                                               III  II  aVR
                                                aVF     + 30°
         1                              3 + 120°  + 90°  + 60°        185


       Silbernagl/Lang, Color Atlas of Pathophysiology © 2000 Thieme
       All rights reserved. Usage subject to terms and conditions of license.