
Page 29 - Color Atlas Of Pathophysiology (S Silbernagl Et Al, Thieme 2000)
P. 29
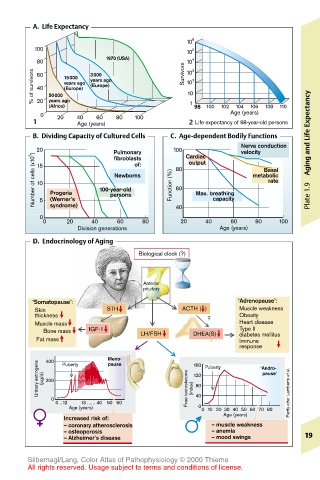
A.  Life Expectancy
                                           10 6
         100                                5
                                           10
                         1970 (USA)
         80                                10 4 3
        % of survivors  60  50000 15000  3000  Survivors  10 2
                                           10
                     years ago
               vears ago
                     (Europe)
         40
               (Europe)
                                           10
         20
            years ago
            (Africa)                        1  98  100  102  104  106  108  110  Expectancy
          0   20  40   60  80  100                   Age (years)
        1         Age (years)               2 Life expectancy of 98-year-old persons
        B.  Dividing Capacity of Cultured Cells  C.  Age-dependent Bodily Functions
                                                       Nerve conduction
         20                Pulmonary    100  Cardiac   velocity        Aging and Life
         Number of cells (x10 5 )  15  Progeria  100-year-old  of:  Function (%)  80  Max. breathing  metabolic  Plate 1.9
                           fibroblasts
                                            output
                                                            Basal
                           Newborns
                                                             rate
         10
                                         60
                          persons
                                                 capacity
            syndrome)
          0 5  (Werner’s                 40
           0    20    40   60    80       20   40    60   80    100
                  Division generations            Age (years)
        D.  Endocrinology of Aging
                                Biological clock (?)
                                 Anterior
                                 pituitary
        ‘Somatopause’:                                 ‘Adrenopause’:
         Skin            STH              ACTH (  )    Muscle weakness
         thickness                              ?      Obesity
         Muscle mass                                   Heart disease
           Bone mass  IGF-1      LH/FSH     DHEA(S)    Type II
                                                       diabetes mellitus
         Fat mass                                      Immune
                                                       response
                         Meno-
           400
          Urinary estrogens  (µg/d)  200  Puberty  pause  Free testosterone  (index)  160  Puberty    pause’
                                                            ‘Andro-
                                             120
                                             80
             0                               40                   Partly after Lamberts et al.
              0 ..12  13 ...... 40 50 60
                 Age (years)                  0 0 10 20 30 40 50 60 70 80
                                                   Age (years)
               Increased risk of:
               – coronary atherosclerosis        – muscle weakness
               – osteoporosis                    – anemia
               – Alzheimer’s disease             – mood swings        19
       Silbernagl/Lang, Color Atlas of Pathophysiology © 2000 Thieme
       All rights reserved. Usage subject to terms and conditions of license.