
Page 50 - Hematology_ Basic Principles and Practice ( PDFDrive )
P. 50
22 Part I Molecular and Cellular Basis of Hematology
behavior (Fig. 2.4). Thus, interpreting the epigenetic code requires human tissues, respectively. The most versatile and widely available
measuring transcriptional activity in addition to chromatin features. tool for visualizing epigenomic data is the UCSC Genome Browser,
Measurement of global transcript levels by mRNA sequencing (RNA- which incorporates easy access to ENCODE, Roadmap, and other
Seq) is now the most common technique used to study gene expres- data sources for integrative analysis of epigenomic and gene expres-
sion, but interest is growing in the related genomic run-on sequencing sion data (Fig. 2.5).
(GRO-Seq) technique. GRO-Seq measures active transcription rather
than total cellular transcript level and therefore holds promise for
improved correlation with epigenomic data. MECHANISMS OF DISEASE
Several collaborative research consortia are dedicated to generating
and curating genome-wide epigenetic data for public use, including The mechanisms of disease described in this chapter are not strictly
the National Human Genome Research Institute (NHGRI) epigenetic, insofar as they are all predicated on changes in genome
ENCODE and Roadmap Epigenomics projects. These resources sequence or structure (genetic mutations). Nonetheless, insights into
include results of histone modifications and transcription factor disease pathogenesis and development of novel therapeutic targets
ChIP-Seq, DNase-Seq, DNA methylation sequencing, and RNA-Seq have been vastly informed by understanding the ways in which these
experiments for hundreds of human cancer cell lines and primary genetic changes drive aberrant chromatin regulation and gene
expression.
Sickle cell anemia has long been known to result from a point
Transcription factor mutation in the hemoglobin beta gene. The severity of this often
binding life-threatening hemoglobinopathy is attenuated in patients having
Remodeling complex increased expression of the fetal gamma hemoglobin variant, a trait
recruitment Repressive histone known as hereditary persistence of fetal hemoglobin (HFPH).
Activating histone methylation Genome-wide association studies in patients with HFPH identified
modifications frequent single-nucleotide polymorphisms (SNPs) in a small number
Histone variants DNA methylation
of noncoding regions near the BCL11A gene on chromosome 2.
Subsequent studies have elegantly demonstrated that these SNPs are
located in erythroid-specific enhancers modulating BCL11A expres-
sion. The HFPH-associated SNPs diminish binding of transcription
factors GATA-binding protein 1 (GATA1) and T-cell acute lympho-
cytic leukemia protein 1 (TAL1), which results in decreased expres-
sion of BCL11A. Because BCL11A is required for efficient silencing
of fetal hemoglobin expression, patients with sickle cell anemia
having these common variant SNPs demonstrate elevated fetal
hemoglobin throughout adulthood and are often protected from the
most severe manifestations of the disease. Just as sickle cell anemia is
among the most striking examples of disease caused by a point
mutation in the coding region of a gene, these BCL11A enhancer
SNPs demonstrate the power of gene-regulatory elements to modulate
the sickle cell disease phenotype.
Chromosomal translocations that result in aberrant expression
Accessible Restricted of oncogenes or leukemogenic transcription factors are another
information information
common mechanism of disease. The classical example of this is
Euchromatin Heterochromatin Burkitt lymphoma, in which t(8;13) translocations juxtapose the
highly active immunoglobulin heavy chain enhancers and the c-myc
Active Repressed oncogene, driving myc overexpression and oncogenic transformation
of mature B cells. Similarly, many different translocations have been
Fig. 2.4 DNA–PROTEIN INTERACTIONS IN EUCHROMATIN AND identified in T-cell acute lymphoblastic leukemia (T-ALL) whereby
HETEROCHROMATIN.
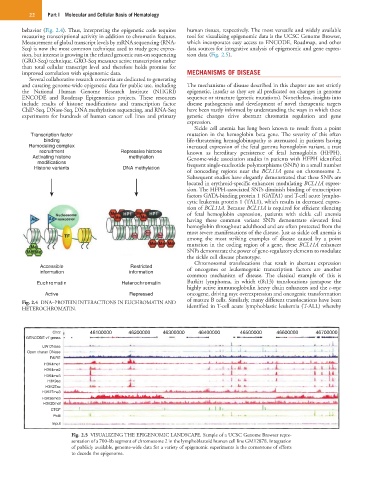
Chr2 46100000 46200000 46300000 46400000 46500000 46600000 46700000
GENCODE v7 genes
UW DNase
Open charan DNase
FAIRE
H3K4me1
H3K4me2
H3K4me3
H3K9ac
H3K27ac
H3K27me3
H3K36me3
H3K20mef
CTCF
PolII
Input
Fig. 2.5 VISUALIZING THE EPIGENOMIC LANDSCAPE. Sample of a UCSC Genome Browser repre-
sentation of a 700-kb segment of chromosome 2 in the lymphoblastoid human cell line GM12878. Integration
of publicly available, genome-wide data for a variety of epigenomic experiments is the cornerstone of efforts
to decode the epigenome.