
Page 54 - Hematology_ Basic Principles and Practice ( PDFDrive )
P. 54
26 Part I Molecular and Cellular Basis of Hematology
heterogeneity involves analyzing cells at the single-cell level, as all of these methods identify major associations within a given dataset
described later. if the signature is strong and robust. Great care must be taken in the
At the level of DNA analysis (as opposed to RNA analysis), the interpretation of clustering results because clusters with distinct gene
admixture of nonmalignant cells within a tumor may not obscure the expression profiles may be caused not only by biologically important
presence of mutations in the tumor cells, even if those cells represent distinctions but also by artefacts of sample processing. Unsupervised
a minority population. However, the detection of mutations in a learning methods that have been used include hierarchical clustering,
subset of cells within a sample requires extra depth of sequencing principal component analysis, nonnegative matrix factorization, k-
beyond what would be required to sequence, for example, a normal means clustering, and t-distributed stochastic neighbor embedding.
diploid genome. Thus it becomes critical to have a rough estimate of Supervised learning approaches are best suited for comparing data
the purity of a given sample so that the appropriate genomic approach between two or more classes of samples that can be distinguished by
can be used subsequently. some known property (or class distinction), such as biologic subtype
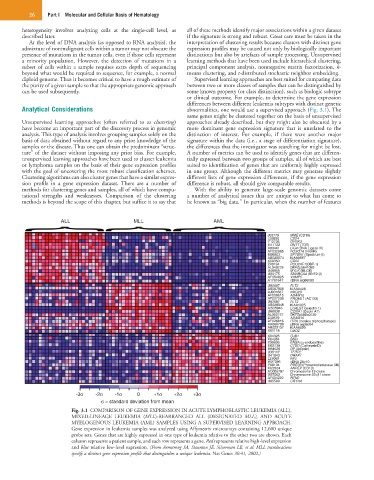
or clinical outcome. For example, to determine the gene expression
differences between different leukemia subtypes with distinct genetic
Analytical Considerations abnormalities, one would use a supervised approach (Fig. 3.1). The
same genes might be clustered together on the basis of unsupervised
Unsupervised learning approaches (often referred to as clustering) approaches already described, but they might also be obscured by a
have become an important part of the discovery process in genomic more dominant gene expression signature that is unrelated to the
analysis. This type of analysis involves grouping samples solely on the distinction of interest. For example, if there were another major
basis of data obtained without regard to any prior knowledge of the signature within the data (i.e., a stage of differentiation signature),
samples or the disease. Thus one can obtain the predominant “struc- the differences that the investigator was searching for might be lost.
ture” of the dataset without imposing any prior bias. For example, A number of metrics can be used to identify genes that are differen-
unsupervised learning approaches have been used to cluster leukemia tially expressed between two groups of samples, all of which are best
or lymphoma samples on the basis of their gene expression profiles suited to identification of genes that are uniformly highly expressed
with the goal of uncovering the most robust classification schemes. in one group. Although the different metrics may generate slightly
Clustering algorithms can also cluster genes that have a similar expres- different lists of gene expression differences, if the gene expression
sion profile in a gene expression dataset. There are a number of difference is robust, all should give comparable results.
methods for clustering genes and samples, all of which have compu- With the ability to generate large-scale genomic datasets come
tational strengths and weaknesses. Comparison of the clustering a number of analytical issues that are unique to what has come to
methods is beyond the scope of this chapter, but suffice it to say that be known as “big data.” In particular, when the number of features
ALL MLL AML
J03779 MME (CD10)
L33930 CD24
Y12735 DYRK3
M11722 DNTT (TDT)
X83441 LIG4 (DNA Ligase IV)
AF032885 FOXO1A (FKHR)
M96803 SPTBN1 (Spectrum-β)
AB020674 KIAA0867
X59350 CD22
Z49194 POU2AF1(OBF-1)
AL049279 DKFZp5641083
U48959 MYLK (MLCK)
U29175 SMARCA4 (SNF2-β)
AF054825 VAMP5
A1761647 cDNA wg66h09
U02687 FLT3
AB007888 KIAA0428
AJ001687 NKG2D
AF009615 ADAM10
AF027208 PROML1 (AC133)
U02687 FLT3
AB028948 KIAA1025
AI535946 LGALS1 Galectin 1)
U66838 CCNA1 (Cyclin A1)
AL050157 DKFZp586o0120
Z48579 ADAM10
AF026816 ITPA (Inosine triphosphatase)
AA669799 cDNA ag36c04
AB023137 KIAA0920
X61118 LMO2
X04325 GJB1
X64364 BSG
X99906 ENSA (α-endosulfine)
M63138 CTSD (CathepsinD)
M84526 DF (Adipsin)
U35117 TFDP2
U41843 DRAP1
L27066 NF2
W27095 cDNA 20c10
Y08134 PDE3B (Phosphodiesterase 3B)
M22324 ANPEP (CD13)
AC005787 Chromosome 19 clone
DB7002 Chromosome 22q11 clone
AF004222 RTN2
U05569 CRYAA
-3σ -2σ -1σ 0 +1σ +2σ +3σ
σ = standard deviation from mean
Fig. 3.1 COMPARISON OF GENE EXPRESSION IN ACUTE LYMPHOBLASTIC LEUKEMIA (ALL),
MIXED-LINEAGE LEUKEMIA (MLL)-REARRANGED ALL (DESIGNATED MLL), AND ACUTE
MYELOGENOUS LEUKEMIA (AML) SAMPLES USING A SUPERVISED LEARNING APPROACH.
Gene expression in leukemia samples was analyzed using Affymetrix microarrays containing 12,600 unique
probe sets. Genes that are highly expressed in one type of leukemia relative to the other two are shown. Each
column represents a patient sample, and each row represents a gene. Red represents relative high-level expression
and blue relative low-level expression. (From Armstrong SA, Staunton JE, Silverman LB, et al: MLL translocations
specify a distinct gene expression profile that distinguishes a unique leukemia. Nat Genet 30:41, 2002.)