
Page 43 - Williams Hematology ( PDFDrive )
P. 43
18 Part I: Clinical Evaluation of the Patient Chapter 2: Examination of Blood Cells 19
1
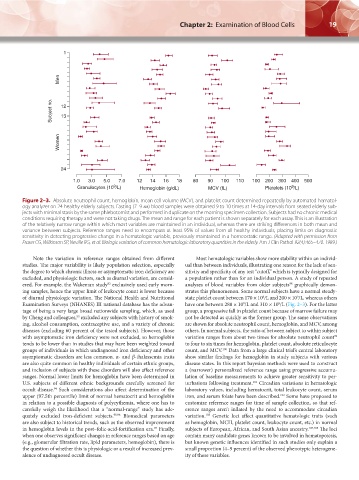
Men
Subject no. 12
13
Women
24
1.0 3.0 5.0 7.0 12 14 16 18 80 90 100 110 100 200 300 400 500
9
9
Granulocytes (10 /L) Hemoglobin (g/dL) MCV (fL) Platelets (10 /L)
Figure 2–3. Absolute neutrophil count, hemoglobin, mean cell volume (MCV), and platelet count determined repeatedly by automated hematol-
ogy analyzer on 24 healthy elderly subjects. Fasting (7–9 am) blood samples were obtained 9 to 10 times at 14-day intervals from seated elderly sub-
jects with minimal stasis by the same phlebotomist and performed in duplicate on the morning specimen collection. Subjects had no chronic medical
conditions requiring therapy and were not taking drugs. The mean and range for each patient is shown separately for each assay. This is an illustration
of the relatively narrow range within which most variables are maintained in an individual, whereas there are striking differences in both mean and
variance between subjects. Reference ranges need to encompass at least 95% of values from all healthy individuals, placing limits on diagnostic
sensitivity in detecting progressive change in a hematologic variable, previously maintained in a homeostatic range. (Adapted with permission from
Fraser CG, Wilkinson SP, Neville RG, et al: Biologic variation of common hematologic laboratory quantities in the elderly. Am J Clin Pathol 92(4):465–470. 1989.)
Note the variation in reference ranges obtained from different Most hematologic variables show more stability within an individ-
studies. The major variability is likely population selection, especially ual than between individuals, illustrating one reason for the lack of sen-
the degree to which chronic illness or asymptomatic iron deficiency are sitivity and specificity of any test “cutoff,” which is typically designed for
excluded, and physiologic factors, such as diurnal variation, are consid- a population rather than for an individual person. A study of repeated
ered. For example, the Wakeman study exclusively used early morn- analyses of blood variables from older subjects graphically demon-
98
92
ing samples, hence the upper limit of leukocyte count is lower because strates this phenomenon. Some normal subjects have a normal steady-
of diurnal physiologic variation. The National Health and Nutritional state platelet count between 170 × 10 /L and 200 × 10 /L, whereas others
9
9
Examination Surveys (NHANES) III national database has the advan- have one between 280 × 10 /L and 310 × 10 /L (Fig. 2–3). For the latter
9
9
tage of being a very large broad nationwide sampling, which, as used group, a progressive fall in platelet count because of marrow failure may
by Cheng and colleagues, excluded any subjects with history of smok- not be detected as quickly as the former group. The same observations
93
ing, alcohol consumption, contraceptive use, and a variety of chronic are shown for absolute neutrophil count, hemoglobin, and MCV, among
diseases (excluding 60 percent of the tested subjects). However, those others. In normal subjects, the ratio of between subject to within subject
with asymptomatic iron deficiency were not excluded, so hemoglobin variation ranges from about two times for absolute neutrophil count
99
tends to be lower than in studies that may have been weighted toward to four to six times for hemoglobin, platelet count, absolute reticulocyte
groups of individuals in which undiagnosed iron deficiency and other count, and MCV. Data from a large clinical trial’s central laboratory
100
asymptomatic disorders are less common. α- and β-thalassemia traits show similar findings for hemoglobin in study subjects with various
are also quite common in healthy individuals of certain ethnic groups, disease states. In this report bayesian methods were used to construct
and inclusion of subjects with these disorders will also affect reference a (narrower) personalized reference range using progressive accumu-
ranges. Normal lower limits for hemoglobin have been determined in lation of baseline measurements to achieve greater sensitivity to per-
U.S. subjects of different ethnic backgrounds carefully screened for turbations following treatment. Circadian variations in hematologic
101
occult disease. Such considerations also affect determination of the laboratory values, including hematocrit, total leukocyte count, serum
94
upper (97.5th percentile) limit of normal hematocrit and hemoglobin iron, and serum folate have been described. Some have proposed to
102
in relation to a possible diagnosis of polycythemia, where one has to customize reference ranges for time of sample collection, so that ref-
carefully weigh the likelihood that a “normal-range” study has ade- erence ranges aren’t inflated by the need to accommodate circadian
quately excluded iron-deficient subjects. 95,96 Biomedical parameters variation. Genetic loci affect quantitative hematologic traits (such
103
are also subject to historical trends, such as the observed improvement as hemoglobin, MCH, platelet count, leukocyte count, etc.) in normal
in hemoglobin levels in the post–folic-acid-fortification era. Finally, subjects of European, African, and South Asian ancestry. 104,105 The loci
97
when one observes significant changes in reference ranges based on age contain many candidate genes known to be involved in hematopoiesis,
(e.g., glomerular filtration rate, lipid parameters, hemoglobin), there is but known genetic influences identified in such studies only explain a
the question of whether this is physiologic or a result of increased prev- small proportion (4–9 percent) of the observed phenotypic heterogene-
alence of undiagnosed occult disease. ity of these variables.
Kaushansky_chapter 02_p0011-0026.indd 19 17/09/15 5:34 pm