
Page 42 - Williams Hematology ( PDFDrive )
P. 42
18 Part I: Clinical Evaluation of the Patient Chapter 2: Examination of Blood Cells 19
production of platelets from circulatory destruction or removal as a The platelet and absolute neutrophil counts are lower in individuals of
cause of thrombocytopenia, in an analogous fashion to the use of the African ethnic origin. American men and women of African descent
68
reticulocyte count. The percentage of reticulated platelets is increased in have lower hemoglobin concentrations than do men and women of
destructive thrombocytopenias, but remains within the reference range European descent, a difference that is reduced by half, but still signifi-
in hypoproductive states. Reticulated platelet number or RNA content cant, when subjects with iron deficiency, thalassemia, sickle trait, and
82
83
90
correlates with imminent platelet recovery after chemotherapy. Retic- renal disease are excluded. Important clinical consequences may
ulated platelet number is correlated with risk of death in patients with result from these differences; for instance, reduced neutrophil counts
85
acute coronary syndrome and DIC, and with hyporesponsiveness to in Americans of African descent result in lower-dose intensity of treat-
84
platelet function inhibitors or aspirin. 87 ment in early stage breast cancer, which may be related to survival out-
86
come disparities. Beutler and West summarize the situation well:
91
90
REFERENCE RANGES “The problem cannot be solved by simply establishing different ranges
for different ethnic groups, especially since all represent some degree of
The use of reference ranges for quantitative hematology measurements admixture. Thus, it is basically information that the physician must pos-
deserves some additional comment. The physiologic variation of certain sess that becomes one of the many factors that we designate as clinical
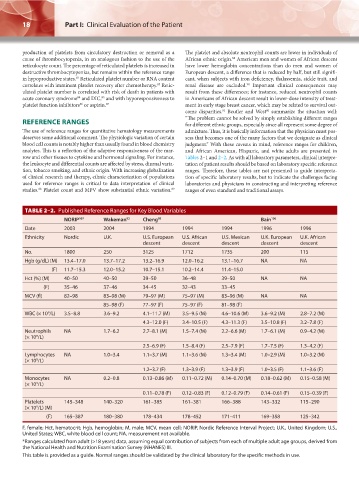
blood cell counts is notably higher than usually found in blood chemistry judgment.” With these caveats in mind, reference ranges for children,
analytes. This is a reflection of the adaptive responsiveness of the mar- and African American, Hispanic, and white adults are presented in
row and other tissues to cytokine and hormonal signaling. For instance, Tables 2–1 and 2–2. As with all laboratory parameters, clinical interpre-
the leukocyte and differential counts are affected by stress, diurnal varia- tation of patient results should be based on laboratory specific reference
tion, tobacco smoking, and ethnic origin. With increasing globalization ranges. Therefore, these tables are not presented to guide interpreta-
of clinical research and therapy, ethnic characterization of populations tion of specific laboratory results, but to indicate the challenges facing
used for reference ranges is critical to data interpretation of clinical laboratories and physicians in constructing and interpreting reference
studies. Platelet count and MPV show substantial ethnic variation. ranges of even standard and traditional assays.
89
88
TABLE 2–2. Published Reference Ranges for Key Blood Variables
NORIP 107 Wakeman 92 Cheng 93 Bain 106
Date 2003 2004 1994 1994 1994 1996 1996
Ethnicity Nordic U.K. U.S. European U.S. African U.S. Mexican U.K. European U.K. African
descent descent descent descent descent
No. 1800 250 3125 1712 1735 200 115
Hgb (g/dL) (M) 13.4–17.0 13.7–17.2 13.2–16.9 12.0–16.2 13.1–16.7 NA NA
(F) 11.7–15.3 12.0–15.2 10.7–15.1 10.2–14.4 11.4–15.0
Hct (%) (M) 40–50 40–50 39–50 36–48 39–50 NA NA
(F) 35–46 37–46 34–45 32–43 33–45
MCV (fl) 82–98 83–98 (M) 79–97 (M) 75–97 (M) 83–96 (M) NA NA
85–98 (F) 77–97 (F) 75–97 (F) 81–98 (F)
WBC (× 10 /L) 3.5–8.8 3.6–9.2 4.1–11.7 (M) 3.5–9.5 (M) 4.6–10.6 (M) 3.6–9.2 (M) 2.8–7.2 (M)
9
4.3–12.0 (F) 3.4–10.5 (F) 4.3–11.3 (F) 3.5–10.8 (F) 3.2–7.8 (F)
Neutrophils NA 1.7–6.2 2.7–8.1 (M) 1.5–7.4 (M) 2.2–6.6 (M) 1.7–6.1 (M) 0.9–4.2 (M)
(× 10 /L)
9
2.5–6.9 (F) 1.5–8.4 (F) 2.5–7.9 (F) 1.7–7.5 (F) 1.3–4.2 (F)
Lymphocytes NA 1.0–3.4 1.1–3.7 (M) 1.1–3.6 (M) 1.3–3.4 (M) 1.0–2.9 (M) 1.0–3.2 (M)
(× 10 /L)
9
1.2–3.7 (F) 1.3–3.9 (F) 1.3–3.9 (F) 1.0–3.5 (F) 1.1–3.6 (F)
Monocytes NA 0.2–0.8 0.13–0.86 (M) 0.11–0.72 (M) 0.14–0.70 (M) 0.18–0.62 (M) 0.15–0.58 (M)
(× 10 /L)
9
0.11–0.78 (F) 0.12–0.83 (F) 0.12–0.79 (F) 0.14–0.61 (F) 0.15–0.39 (F)
Platelets 145–348 140–320 161–385 161–381 166–388 143–332 115–290
9
(× 10 /L) (M)
(F) 165–387 180–380 178–434 178–452 171–411 169–358 125–342
F, female; Hct, hematocrit; Hgb, hemoglobin; M, male; MCV, mean cell; NORIP, Nordic Reference Interval Project; U.K., United Kingdom; U.S.,
United States; WBC, white blood cell count; NA, measurement not available.
*Ranges calculated from adult (>18 years) data, assuming equal contribution of subjects from each of multiple adult age groups, derived from
the National Health and Nutrition Examination Survey (NHANES) III.
This table is provided as a guide. Normal ranges should be validated by the clinical laboratory for the specific methods in use.
Kaushansky_chapter 02_p0011-0026.indd 18 17/09/15 5:34 pm