
Page 515 - Williams Hematology ( PDFDrive )
P. 515
490 Part VI: The Erythrocyte Chapter 32: Erythropoiesis 491
Equation 2 The ratio is only an approximation of total erythroid activity because
the ratio can be altered by changing the myeloid and erythroid compo-
corrected reticulocyte%
Reticulocyteindex= nents, and an aspirate or biopsy of a small segment of the marrow may
correctionfactor(usually 2) not always reflect total marrow activity. These assumptions are valid as
long as the marrow reflects the steady-state, if the marrow is recovering
Accordingly, the corrected reticulocyte percent may give an erro- from aplasia, or is developing aplasia, it will not accurately reflect out-
neous impression of the actual rate of daily red cell production. To take put of mature red cells. However, when used in conjunction with deter-
this situation into account when estimating the rate of red cell pro- mination of red blood cell count and reticulocyte count, under most
duction in anemic patients with high reticulocyte counts, dividing the circumstances the ratio provides qualitative information about the rate
corrected reticulocyte percent by a factor may provide a more accurate and effectiveness of red blood cell production. A more accurate quan-
estimate of red cell production. For simplicity, an average factor of titation of total erythropoiesis can be made by measuring the rate of
156
2 often is used; however, the factor depends on the degree of anemia: production of red cells (ferrokinetics) or, in steady-state conditions, the
1.5 in mild cases, 2.5 in moderate cases, and 3.0 in severe cases. rate of destruction of red cells (red cell life span, bilirubin production,
An example follows: A patient with autoimmune hemolytic ane- carbon monoxide excretion).
mia has a Hct of 10 and reticulocyte count of 70 percent. The marrow
cannot increase production by 70-fold. To measure the approximate
true increase, we calculate the reticulocyte index as follows: corrected FERROKINETICS
158
reticulocyte percent = 70 × 10/45 = 15, and the reticulocyte index = In 1950, Huff and associates described a method for measuring the
15/3= 5 × basal. Thus, marrow erythroid production in response to rate of red cell production utilizing a simple model of iron metabolism
this severe anemia has increased fivefold, a plausible response to this (Fig. 32–9; Chap. 42). In this method, radioactive iron is complexed to
severity of hemolytic anemia. transferrin in vitro and injected intravenously. Alternatively, Fe can be
59
injected directly intravenously as the gluconate without preincubation
with the patient’s own plasma, providing enough unbound transferrin is
INEFFECTIVE RED CELL PRODUCTION available, because binding is almost instantaneous. The rate of clearance
59
Ineffective erythropoiesis is suspected when the reticulocyte count is of the transferrin-bound iron from the plasma ( Fe plasma T ) and the
1/2
normal or only slightly increased despite erythroid hyperplasia of the subsequent uptake in the red cells are measured. From these two values
marrow. Ineffective erythropoiesis was first recognized as an entity and from determinations of plasma iron concentration and plasma vol-
from the study of isotope incorporation into fecal urobilin following ume, the rate of formation of red cells can be calculated. 38
administration of labeled glycine, a precursor of heme. Two peaks The initial clearance of iron is exponential, and sampling during
157
were observed: an early peak at 3 to 5 days and a late peak at 100 to 120 this period can be used to calculate T . In normal individuals, initial
1/2
days. One of the sources of the early labeled peak was suggested to be the clearance averages approximately 90 minutes. Initial clearance is shorter
hemoglobin of red cells that had never completed their development, in patients with hyperplasia of the erythropoietic tissue and longer in
having been destroyed either in the marrow or shortly after reaching patients with marrow hypoplasia (see Fig. 32–9). However, the clear-
the blood. Subsequent studies revealed that in certain disorders, such ance rate is not a direct measurement of erythropoietic activity because
as pernicious anemia, thalassemia, and sideroblastic anemia, ineffective it depends on the size of the pool of unlabeled, circulating iron. Con-
erythropoiesis is a major component of total erythropoiesis. This compo- sequently, calculation of the plasma iron turnover rate must include
nent can be quantitated by measuring N-labeled glycine incorporation the plasma iron concentration. Clearance is expressed in milligrams of
15
into the early bilirubin peaks or ferrokinetics. Calculated from biliru- iron. The point of reference can be hemoglobin mass, blood volume,
38
157
bin peaks and turnover, ineffective erythropoiesis under normal condi-
tions amounts to approximately 4 to 12 percent of total erythropoiesis.
Using ferrokinetic methods, ineffective erythropoiesis is calculated as
the difference between total plasma iron turnover and erythrocyte iron
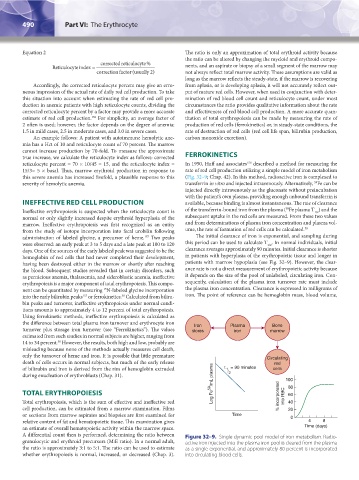
Bone
Iron
turnover plus storage iron turnover (see “Ferrokinetics”). The values stores Plasma marrow
iron
estimated from such studies in normal subjects are higher, ranging from
14 to 34 percent. However, the results, both high and low, probably are
38
misleading because none of the methods actually measures cell death,
only the turnover of heme and iron. It is possible that little premature Circulating
death of cells occurs in normal subjects, but much of the early release red
of bilirubin and iron is derived from the rim of hemoglobin extruded t = 90 minutes cells
1
/
during enucleation of erythroblasts (Chap. 31). 2 100
TOTAL ERYTHROPOIESIS Log Fe 59 /mL plasma % incorporated into RBC 80
60
Total erythropoiesis, which is the sum of effective and ineffective red 40
cell production, can be estimated from a marrow examination. Films 20
or sections from marrow aspirates and biopsies are first examined for Time 0
relative content of fat and hematopoietic tissue. This examination gives 4 8
an estimate of overall hematopoietic activity within the marrow space. Time (days)
A differential count then is performed, determining the ratio between Figure 32–9. Single dynamic pool model of iron metabolism. Radio-
granulocytic and erythroid precursors (M:E ratio). In a normal adult, active iron injected into the plasma iron pool is cleared from the plasma
the ratio is approximately 3:1 to 5:1. The ratio can be used to estimate as a single exponential, and approximately 80 percent is incorporated
whether erythropoiesis is normal, increased, or decreased (Chap. 3). into circulating blood cells.
Kaushansky_chapter 32_p0479-0494.indd 490 9/17/15 6:11 PM