
Page 513 - Williams Hematology ( PDFDrive )
P. 513
488 Part VI: The Erythrocyte Chapter 32: Erythropoiesis 489
by the report that the pivotal transcription factors for erythropoiesis, 59 Fe plasma clearance 59 Fe RBC utilization
GATA-1 and NFE-2, directly regulate and control differentiation via Erythroid hypoplasia
miRNA-199b-5p. This miRNA then targets c-Kit, an important recep- Erythroid ineffectiveness
tor on early erythroid cells. Some miRNAs likely play a role in the 10 100
144
commitment to erythroid versus megakaryocytic differentiation. Thus,
miRNA-18a was reported to be upregulated during erythropoiesis 8 Normal
and downregulated during megakaryopoiesis, while miRNA-145 was 6 80 range
upregulated in megakaryopoiesis and downregulated in erythropoie- Normal
sis. Their mRNA targets and their functional significance are being 4 range 60
145
defined. LIN28B and its targeted let-7 have regulated expression CPM x factor Percent uptake
146
during the fetal-to-adult erythroid cell transition. Another impor- 40
tant erythroid development and function is regulated by miRNA-351. 2
A complex regulatory transcriptional repressor system controlling 20
heterochromatin formation exists composed of KRAB-ZFP–mediated
repression that include cofactor KAP1 (KRAB-associated protein-1). 1 0
Deletion of KAP1 in mice upregulates miRNA-351 and several other 0 306090 120150 0 7 Days 14 21
Minutes
microRNAs, which then downregulate Nix and mitochondrial autoph-
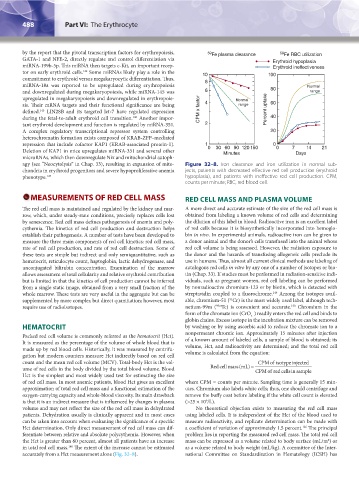
agy (see “Neocytolysis” in Chap. 33), resulting in expansion of mito- Figure 32–8. Iron clearance and iron utilization in normal sub-
chondria in erythroid progenitors and severe hypoproliferative anemia jects, patients with decreased effective red cell production (erythroid
phenotype. 147 hypoplasia), and patients with ineffective red cell production. CPM,
counts per minute; RBC, red blood cell.
MEASUREMENTS OF RED CELL MASS RED CELL MASS AND PLASMA VOLUME
The red cell mass is maintained and regulated by the kidney and mar- A more direct and accurate estimate of the size of the red cell mass is
row, which, under steady-state conditions, precisely replaces cells lost obtained from labeling a known volume of red cells and determining
by senescence. Red cell mass defines pathogenesis of anemia and poly- the dilution of this label in blood. Radioactive iron is an excellent label
cythemia. The kinetics of red cell production and destruction helps of red cells because it is biosynthetically incorporated into hemoglo-
establish their pathogenesis. A number of tests have been developed to bin in vivo. In experimental animals, radioactive iron can be given to
measure the three main components of red cell kinetics: red cell mass, a donor animal and the donor’s cells transfused into the animal whose
rate of red cell production, and rate of red cell destruction. Some of red cell volume is being assessed. However, the radiation exposure to
these tests are simple but indirect and only semiquantitative, such as the donor and the hazards of transfusing allogeneic cells preclude its
hematocrit, reticulocyte count, haptoglobin, lactic dehydrogenase, and use in humans. Thus, almost all current clinical methods use labeling of
unconjugated bilirubin concentration. Examination of the marrow autologous red cells in vitro by any one of a number of isotopes or bio-
allows assessment of total cellularity and relative erythroid contribution tin (Chap. 33). If studies must be performed in radiation-sensitive indi-
but is limited in that the kinetics of cell production cannot be inferred viduals, such as pregnant women, red cell labeling can be performed
from a single static image, obtained from a very small fraction of the by nonradioactive chromium-123 or by biotin, which is detected with
whole marrow. These tests are very useful in the aggregate but can be streptavidin coupled to a fluorochrome. Among the isotopes avail-
149
supplemented by more complex but direct quantitation; however, most able, chromium-51 ( Cr) is the most widely used label, although tech-
51
150
99m
require use of radioisotopes. netium-99m ( Tc) is convenient and accurate. Chromium in the
form of the chromate ion (CrO ) readily enters the red cell and binds to
−
2
globin chains. Excess isotope in the incubation mixture can be removed
HEMATOCRIT by washing or by using ascorbic acid to reduce the chromate ion to a
Packed red cell volume is commonly referred as the hematocrit (Hct). nonpermeant chromic ion. Approximately 15 minutes after injection
It is measured as the percentage of the volume of whole blood that is of a known amount of labeled cells, a sample of blood is obtained; its
made up by red blood cells. Historically, it was measured by centrifu- volume, Hct, and radioactivity are determined; and the total red cell
gation but modern counters measure Hct indirectly based on red cell volume is calculated from the equation:
count and the mean red cell volume (MCV). Total-body Hct is the vol- CPMofisotypeinjected
ume of red cells in the body divided by the total blood volume. Blood Redcellmass(mL)= CPMofred cellsin sample
Hct is the simplest and most widely used test for estimating the size
of red cell mass. In most anemic patients, blood Hct gives an excellent where CPM = counts per minute. Sampling time is generally 15 min-
approximation of total red cell mass and a functional estimation of the utes. Chromium also labels white cells; thus, one should centrifuge and
oxygen-carrying capacity and whole-blood viscosity. Its main drawback remove the buffy coat before labeling if the white cell count is elevated
is that it is an indirect measure that is influenced by changes in plasma (>25 × 10 /L).
9
volume and may not reflect the size of the red cell mass in dehydrated No theoretical objection exists to measuring the red cell mass
patients. Dehydration usually is clinically apparent and in most cases using labeled cells. It is independent of the Hct of the blood used to
can be taken into account when evaluating the significance of a specific measure radioactivity, and replicate determination can be made with
Hct determination. Only direct measurement of red cell mass can dif- a coefficient of variation of approximately 1.5 percent. The principal
126
ferentiate between relative and absolute polycythemia. However, when problem lies in reporting the measured red cell mass. The total red cell
the Hct is greater than 60 percent, almost all patients have an increase mass can be expressed as a volume related to body surface (mL/m ) or
2
in total red cell mass. The extent of the increase cannot be estimated as a volume related to body weight (mL/kg). A committee of the Inter-
148
accurately from a Hct measurement alone (Fig. 32–8). national Committee on Standardization in Hematology (ICSH) has
Kaushansky_chapter 32_p0479-0494.indd 488 9/17/15 6:11 PM