
Page 516 - Williams Hematology ( PDFDrive )
P. 516
490 Part VI: The Erythrocyte Chapter 32: Erythropoiesis 491
or weight, but a commonly used expression is micrograms of iron per erroneous impressions of the state of erythropoiesis. Moreover, more
deciliters of whole blood per day: prolonged sampling of plasma following an intravenous injection of
Plasma iron turnover rate (mg iron/dL blood/24 h) 59 Fe has shown that clearance is not a single exponential, but must
159
be represented by several exponential components. This finding
plasma iron(mgdL) × (100–Hct) has led to the introduction of more complex models of iron kinet-
= ics with a single pool of plasma iron exchanging with a number of
T 1/2 (min) ×100 extravascular erythroid and nonerythroid pools. Careful analysis of
Under normal conditions, radioactive iron is incorporated into such models has generated computer-supported methods calculating
newly formed red cells after a few days and reaches a maximum approx- the degree and effectiveness of erythroid activity. Although possi-
160
imately 10 to 14 days after injection (see Fig. 32–9). Normal utilization bly more accurate than the conventional method of calculating iron
is 70 to 90 percent on day 10 to 14, a value that is so high that further turnover, the models appear to be too cumbersome for clinical use.
increases have little significance. However, decreased utilization is an Moreover, even these sophisticated methods may not give an accu-
important finding and suggests immature red cells are destroyed in rate account of the state of erythropoiesis. Despite a constant rate of
the marrow before they are released to the circulation (ineffective ery- red cell production, the plasma iron turnover was found to increase
thropoiesis) or that serum iron is diverted to nonerythropoietic tissues with increasing plasma iron and transferrin saturation. This finding
(marrow hypoplasia). The shape of the red cell utilization curve also is was first thought to result from increased nonerythroid iron uptake
important. An early and steep rise (rapid marrow transit time) suggests and led to the introduction of various correction factors in the calcu-
a high EPO level. Finally, an early rise in utilization with a subsequent lation of red cell iron turnover. However, the iron in plasma is pres-
160
fall off suggests hemolysis. ent in two pools, a diferric and a monoferric transferrin pool (Chap.
When calculating utilization, the blood volume must be known: 42), and the erythroid and nonerythroid receptors have a four times
Red cell iron utilization (%) greater avidity for diferric transferrin than for monoferric transferrin.
Consequently, total plasma iron turnover depends on the degree of
CPMofl mL blood × blood volume 100 saturation and does not necessarily reflect the number of transferrin
×
= 59 receptors, presumably a critical measure of erythropoietic capacity.
161
CPMof Feinjected To measure the number of transferrin receptors, adjusting the plasma
Using the plasma iron clearance and utilization of iron, the red iron turnover equations for both nonerythroid uptake and degree of
cell turnover in milligrams per dL blood for 24-hours is calculated as transferrin saturation and expressing the plasma turnover in terms of
162
follows: transferrin rather than iron have been proposed. Normal erythroid
Red cell iron turnover (mg iron/dL blood/24 h) = plasma iron uptake of transferrin is 60 ± 12 μmol/L of blood per day, a value that
turnover × maximal red cell iron utilization has appropriately decreased and increased in patients with hypoplastic
The normal value of red cell iron turnover is 0.30 to 0.70 mg/dL and hyperplastic marrow.
38
blood per 24 hours. This range fits very well with a crude estimation of
the iron used for maintaining the red cell mass in 1 dL of blood or 45 mL
of packed red cells. The daily red cell production must equal the daily REFERENCES
red cell destruction (45 mL/120 = 0.38 mL), assuming a red cell life span
of 120 days. Because 1 mL of packed red cells contains approximately 1 1. Erslev AJ: Blood and mountains, in Blood, Pure and Eloquent, edited by MM Wintrobe,
p 257. McGraw-Hill, New York, 1980.
mg of iron, a daily plasma iron turnover of 0.38 mg is needed by 1 dL of 2. Carnot P, Deflandre C: Sur l’activité hématopoiétique des serum au cours de la régénéra-
blood to maintain homeostasis. tion du sang. Acad Sci Med 3, 1906.
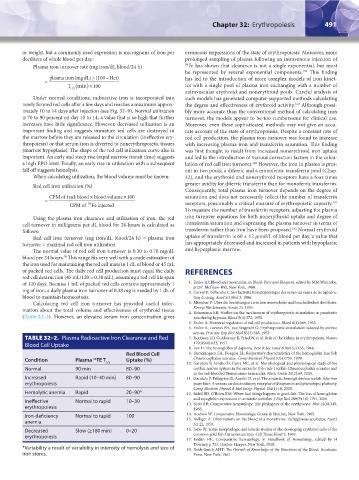
Calculating red cell iron turnover has provided useful infor- 3. Miescher F: Über die beziehungen zwischen meereshohe und beschaffenheit des blutes.
Koresp Bltt Schweitz Aerzte 24, 1893.
mation about the total volume and effectiveness of erythroid tissue 4. Reissmann KR: Studies on the mechanism of erythropoietic stimulation in parabiotic
(Table 32–2). However, an elevated serum iron concentration gives rats during hypoxia. Blood 5(4):372, 1950.
5. Erslev A: Humoral regulation of red cell production. Blood 8(4):349, 1953.
6. Erslev A, Lavietes PH, Van Wagenen G: Erythropoietic stimulation induced by anemic
serum. Proc Soc Exp Biol Med 83(3):548, 1953.
TABLE 32–2. Plasma Radioactive Iron Clearance and Red 7. Jacobson LO, Goldwasser E, Fried W, et al: Role of the kidney in erythropoiesis. Nature
Blood Cell Uptake 179(4560):633, 1957.
8. Fox H: The hemoglobin of daphnia. Proc R Soc Lond B Biol Sci 135, 1948.
Red Blood Cell 9. Hemmingsen EA, Douglas EL: Respiratory characteristics of the hemoglobin-free fish
Condition Plasma FE T Uptake (%) Chaenocephalus aceratus. Comp Biochem Physiol 33(4):733, 1970.
59
1/2 10. Garofalo F, Amelio D, Cerra MC, et al: Morphological and physiological study of the
Normal 90 min 80–90 cardiac nos/no system in the antarctic (hb-/mb-) icefish Chaenocephalus aceratus and
in the red-blooded Trematomus bernacchii. Nitric Oxide 20(2):69, 2009.
Increased Rapid (10–40 min) 80–90 11. Garofalo F, Pellegrino D, Amelio D, et al: The antarctic hemoglobinless icefish, fifty-five
erythropoiesis years later: A unique cardiocirculatory interplay of disaptation and phenotypic plasticity.
Comp Biochem Physiol A Mol Integr Physiol 154(1):10, 2009.
Hemolytic anemia Rapid 20–90* 12. Sidell BD, O’Brien KM: When bad things happen to good fish: The loss of hemoglobin
and myoglobin expression in antarctic icefishes. J Exp Biol 209(Pt 10):1791, 2006.
Ineffective Normal to rapid 10–30 13. Scott RB: Comparative hematology: The phylogeny of the erythrocyte. Blut 12(6):340,
erythropoiesis 1966.
Iron-deficiency Normal to rapid 100 14. Andrew W: Comparative Hematology, Grune & Stratton, New York, 1965.
anemia 15. Bolliger A: Observations on the blood of a monotreme Tachyglossus aculeatus. Aust J
Sci 22, 1959.
Decreased Slow (≥180 min) 0–20 16. Iorio RJ: Some morphologic and kinetic studies of the developing erythroid cells of the
erythropoiesis common gold fish Carassius auratus. Cell Tissue Kinet 2, 1969.
17. Jordan HE: Comparative hematology, in Handbook of Hematology, edited by H
Downey, p 703. Hoeber-Harper, New York, 1938.
*Variability a result of variability in intensity of hemolysis and size of 18. Robb-Smith AHT: The Growth of Knowledge of the Functions of the Blood, Academic
iron stores. Press, New York, 1961.
Kaushansky_chapter 32_p0479-0494.indd 491 9/17/15 6:11 PM