
Page 15 - CRC_One Report 2021_EN
P. 15
Business Overview and Performance Corporate Governance Financial Statements Enclosure
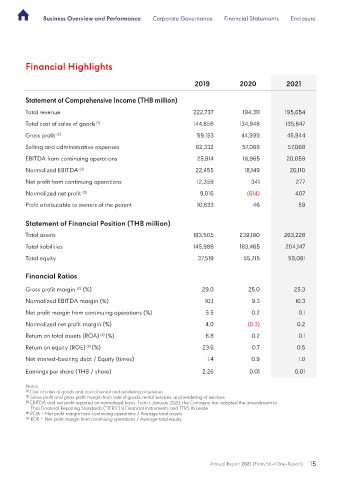
Financial Highlights
2019 2020 2021
Statement of Comprehensive Income (THB million)
Total revenue 222,737 194,311 195,654
Total cost of sales of goods (1) 144,856 134,948 135,847
Gross profit (2) 59,153 44,999 45,944
Selling and administrative expenses 62,332 57,088 57,068
EBITDA from continuing operations 25,814 18,965 20,059
Normalized EBITDA (3) 22,455 18,149 20,110
Net profit from continuing operations 12,359 341 277
Normalized net profit (3) 9,016 (614) 407
Profit attributable to owners of the parent 10,633 46 59
Statement of Financial Position (THB million)
Total assets 183,505 239,180 263,228
Total liabilities 145,986 183,465 204,147
Total equity 37,519 55,715 59,081
Financial Ratios
(2)
Gross profit margin (%) 29.0 25.0 25.3
Normalized EBITDA margin (%) 10.1 9.3 10.3
Net profit margin from continuing operations (%) 5.5 0.2 0.1
Normalized net profit margin (%) 4.0 (0.3) 0.2
Return on total assets (ROA) (4) (%) 6.8 0.2 0.1
Return on equity (ROE) (5) (%) 23.6 0.7 0.5
Net interest-bearing debt / Equity (times) 1.4 0.9 1.0
Earnings per share (THB / share) 2.26 0.01 0.01
Notes:
(1) Cost of sales of goods and cost of rental and rendering of services
(2) Gross profit and gross profit margin from sale of goods, rental services, and rendering of services
(3) EBITDA and net profit reported on normalized basis. From 1 January 2020, the Comapny has adopted the amendment to
Thai Financial Reporting Standards (“TFRS”) 9 Financial Instruments and TFRS 16 Lease
(4)
ROA = Net profit margin from continuing operations / Average total assets
(5) ROE = Net profit margin from continuing operations / Average total equity
Annual Report 2021 (Form 56-1 One-Report) 15