
Page 228 - CRC_One Report 2021_EN
P. 228
Business Overview and Performance Corporate Governance Financial Statements Enclosure
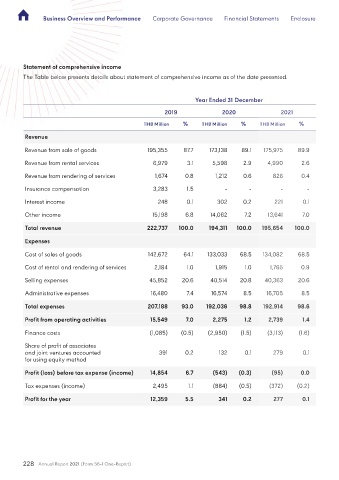
Statement of comprehensive income
The Table below presents details about statement of comprehensive income as of the date presented.
Year Ended 31 December
2019 2020 2021
THB Million % THB Million % THB Million %
Revenue
Revenue from sale of goods 195,355 87.7 173,138 89.1 175,975 89.9
Revenue from rental services 6,979 3.1 5,598 2.9 4,990 2.6
Revenue from rendering of services 1,674 0.8 1,212 0.6 826 0.4
Insurance compensation 3,283 1.5 - - - -
Interest income 248 0.1 302 0.2 221 0.1
Other income 15,198 6.8 14,062 7.2 13,641 7.0
Total revenue 222,737 100.0 194,311 100.0 195,654 100.0
Expenses
Cost of sales of goods 142,672 64.1 133,033 68.5 134,082 68.5
Cost of rental and rendering of services 2,184 1.0 1,915 1.0 1,765 0.9
Selling expenses 45,852 20.6 40,514 20.8 40,363 20.6
Administrative expenses 16,480 7.4 16,574 8.5 16,705 8.5
Total expenses 207,188 93.0 192,036 98.8 192,914 98.6
Profit from operating activities 15,549 7.0 2,275 1.2 2,739 1.4
Finance costs (1,085) (0.5) (2,950) (1.5) (3,113) (1.6)
Share of profit of associates
and joint ventures accounted 391 0.2 132 0.1 279 0.1
for using equity method
Profit (loss) before tax expense (income) 14,854 6.7 (543) (0.3) (95) 0.0
Tax expenses (income) 2,495 1.1 (884) (0.5) (372) (0.2)
Profit for the year 12,359 5.5 341 0.2 277 0.1
228 Annual Report 2021 (Form 56-1 One-Report)