
Page 232 - CRC_One Report 2021_EN
P. 232
Business Overview and Performance Corporate Governance Financial Statements Enclosure
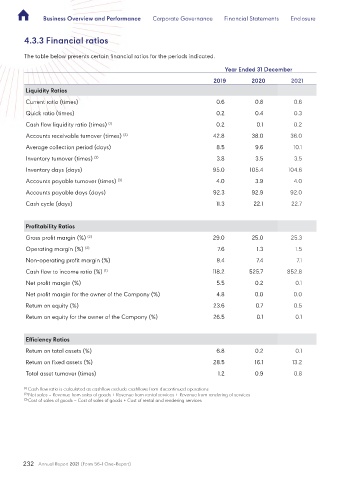
4.3.3 Financial ratios
The table below presents certain financial ratios for the periods indicated.
Year Ended 31 December
2019 2020 2021
Liquidity Ratios
Current ratio (times) 0.6 0.8 0.6
Quick ratio (times) 0.2 0.4 0.3
Cash flow liquidity ratio (times) (1) 0.2 0.1 0.2
Accounts receivable turnover (times) (2) 42.8 38.0 36.0
Average collection period (days) 8.5 9.6 10.1
Inventory turnover (times) (3) 3.8 3.5 3.5
Inventory days (days) 95.0 105.4 104.6
Accounts payable turnover (times) (3) 4.0 3.9 4.0
Accounts payable days (days) 92.3 92.9 92.0
Cash cycle (days) 11.3 22.1 22.7
Profitability Ratios
Gross profit margin (%) (2) 29.0 25.0 25.3
Operating margin (%) (2) 7.6 1.3 1.5
Non-operating profit margin (%) 8.4 7.4 7.1
Cash flow to income ratio (%) (1) 118.2 525.7 852.8
Net profit margin (%) 5.5 0.2 0.1
Net profit margin for the owner of the Company (%) 4.8 0.0 0.0
Return on equity (%) 23.6 0.7 0.5
Return on equity for the owner of the Company (%) 26.5 0.1 0.1
Efficiency Ratios
Return on total assets (%) 6.8 0.2 0.1
Return on fixed assets (%) 28.5 16.1 13.2
Total asset turnover (times) 1.2 0.9 0.8
(1) Cash flow ratio is calculated as cashflow exclude cashflows from discontinued operations
(2) Net sales = Revenue from sales of goods + Revenue from rental services + Revenue from rendering of services
(3) Cost of sales of goods = Cost of sales of goods + Cost of rental and rendering services
232 Annual Report 2021 (Form 56-1 One-Report)