
Page 92 - CRC_One Report 2021_EN
P. 92
Business Overview and Performance Corporate Governance Financial Statements Enclosure
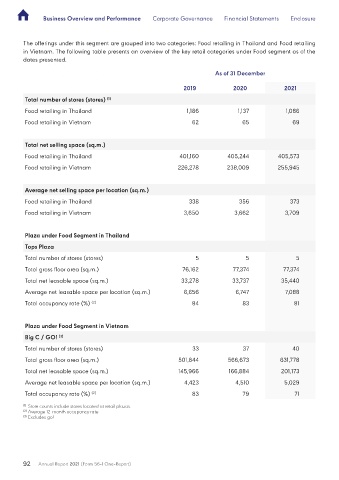
The offerings under this segment are grouped into two categories: Food retailing in Thailand and Food retailing
in Vietnam. The following table presents an overview of the key retail categories under Food segment as of the
dates presented.
As of 31 December
2019 2020 2021
Total number of stores (stores) (1)
Food retailing in Thailand 1,186 1,137 1,086
Food retailing in Vietnam 62 65 69
Total net selling space (sq.m.)
Food retailing in Thailand 401,160 405,244 405,573
Food retailing in Vietnam 226,278 238,009 255,945
Average net selling space per location (sq.m.)
Food retailing in Thailand 338 356 373
Food retailing in Vietnam 3,650 3,662 3,709
Plaza under Food Segment in Thailand
Tops Plaza
Total number of stores (stores) 5 5 5
Total gross floor area (sq.m.) 76,162 77,374 77,374
Total net leasable space (sq.m.) 33,278 33,737 35,440
Average net leasable space per location (sq.m.) 6,656 6,747 7,088
Total occupancy rate (%) (2) 84 83 81
Plaza under Food Segment in Vietnam
Big C / GO! (3)
Total number of stores (stores) 33 37 40
Total gross floor area (sq.m.) 501,844 566,673 631,778
Total net leasable space (sq.m.) 145,966 166,884 201,173
Average net leasable space per location (sq.m.) 4,423 4,510 5,029
Total occupancy rate (%) (2) 83 79 71
(1)
Store counts include stores located at retail plazas.
(2) Average 12-month occupancy rate
(3) Excludes go!
92 Annual Report 2021 (Form 56-1 One-Report)