
Page 618 - 9780077418427.pdf
P. 618
/Volume/201/MHDQ233/tat78194_disk1of1/0073378194/tat78194_pagefile
tiL12214_ch23_565-596.indd Page 595 9/23/10 11:07 AM user-f465
tiL12214_ch23_565-596.indd Page 595 9/23/10 11:07 AM user-f465 /Volume/201/MHDQ233/tat78194_disk1of1/0073378194/tat78194_pagefiles
Group A—Continued Group B—Continued
4
3
3
3
4. A parcel of air with a volume of 8.4 × 10 km that contains 4. A parcel of air with a volume of 9.1 × 10 km that contains
7
6
7.9 × 10 kg of water vapor rises to an altitude where all the water 5.7 × 10 kg of water vapor rises to an altitude where all the water
in the parcel condenses and then freezes. What is the change in in the parcel condenses and then freezes. What is the change in
temperature of the parcel of air due to freezing? (Assume the temperature of the parcel of air due to freezing? (Assume the
2
3
2
3
density of air at the condensation altitude is 5.5 × 10 g/m .) density of the air at the condensation altitude is 7.2 × 10 g/m .)
3
4
4
3
5. A parcel of air with a volume of 8.9 × 10 km rises to an altitude 5. A parcel of air with a volume of 7.3 × 10 km rises to an altitude
where all the water in the parcel condenses and increases the where all the water in the parcel condenses and increases the
temperature of the air parcel by 5.4°C. What is the mass of water temperature of the air parcel by 4.7°C. What is the mass of water
in the air parcel? (Assume the density of air at the condensation in the air parcel? (Assume the density of the air at the
2
3
2
3
altitude is 7.6 × 10 g/m .) condensation altitude is 8.1 × 10 g/m .)
6. Snowfall measuring 2.5 cm deep falls on a concrete sidewalk. 6. Snowfall measuring 2.5 cm deep falls on a concrete bridge. The
3
4
The sidewalk has a mass of 1.8 × 10 kg. The total mass of water bridge has a mass of 6.0 × 10 kg. The total mass of water in the
in the snowfall is 25 kg. What is the change in temperature of the snowfall is 600 kg. What is the change in temperature of the
concrete due to the snow melting? concrete due to the snow melting?
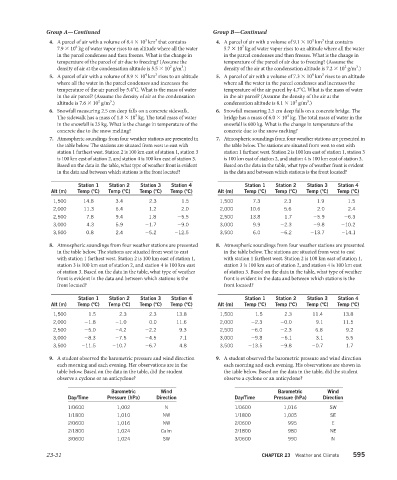
7. Atmospheric soundings from four weather stations are presented in 7. Atmospheric soundings from four weather stations are presented in
the table below. The stations are situated from west to east with the table below. The stations are situated from west to east with
station 1 farthest west. Station 2 is 100 km east of station 1, station 3 station 1 farthest west. Station 2 is 100 km east of station 1, station 3
is 100 km east of station 2, and station 4 is 100 km east of station 3. is 100 km east of station 2, and station 4 is 100 km east of station 3.
Based on the data in the table, what type of weather front is evident Based on the data in the table, what type of weather front is evident
in the data and between which stations is the front located? in the data and between which stations is the front located?
Station 1 Station 2 Station 3 Station 4 Station 1 Station 2 Station 3 Station 4
Alt (m) Temp (°C) Temp (°C) Temp (°C) Temp (°C) Alt (m) Temp (°C) Temp (°C) Temp (°C) Temp (°C)
1,500 14.8 3.4 2.3 1.5 1,500 7.3 2.3 1.9 1.5
2,000 11.3 6.4 −1.2 −2.0 2,000 10.6 5.6 −2.0 −2.4
2,500 7.8 9.4 1.8 −5.5 2,500 13.8 1.7 −5.9 −6.3
3,000 4.3 5.9 −1.7 −9.0 3,000 9.9 −2.3 −9.8 −10.2
3,500 0.8 2.4 −5.2 −12.5 3,500 6.0 −6.2 −13.7 −14.1
8. Atmospheric soundings from four weather stations are presented 8. Atmospheric soundings from four weather stations are presented
in the table below. The stations are situated from west to east in the table below. The stations are situated from west to east
with station 1 farthest west. Station 2 is 100 km east of station 1, with station 1 farthest west. Station 2 is 100 km east of station 1,
station 3 is 100 km east of station 2, and station 4 is 100 km east station 3 is 100 km east of station 2, and station 4 is 100 km east
of station 3. Based on the data in the table, what type of weather of station 3. Based on the data in the table, what type of weather
front is evident in the data and between which stations is the front is evident in the data and between which stations is the
front located? front located?
Station 1 Station 2 Station 3 Station 4 Station 1 Station 2 Station 3 Station 4
Alt (m) Temp (°C) Temp (°C) Temp (°C) Temp (°C) Alt (m) Temp (°C) Temp (°C) Temp (°C) Temp (°C)
1,500 1.5 2.3 2.3 13.8 1,500 1.5 2.3 11.4 13.8
2,000 −1.8 −1.0 0.0 11.6 2,000 −2.3 −0.0 9.1 11.5
2,500 −5.0 −4.2 −2.2 9.3 2,500 −6.0 −2.3 6.8 9.2
3,000 −8.3 −7.5 −4.5 7.1 3,000 −9.8 −6.1 3.1 5.5
3,500 −11.5 −10.7 −6.7 4.8 3,500 −13.5 −9.8 −0.7 1.7
9. A student observed the barometric pressure and wind direction 9. A student observed the barometric pressure and wind direction
each morning and each evening. Her observations are in the each morning and each evening. His observations are shown in
table below. Based on the data in the table, did the student the table below. Based on the data in the table, did the student
observe a cyclone or an anticyclone? observe a cyclone or an anticyclone?
Barometric Wind Barometric Wind
Day/Time Pressure (hPa) Direction Day/Time Pressure (hPa) Direction
1/0600 1,002 N 1/0600 1,016 SW
1/1800 1,010 NW 1/1800 1,005 SE
2/0600 1,016 NW 2/0600 995 E
2/1800 1,024 Calm 2/1800 980 NE
3/0600 1,024 SW 3/0600 990 N
23-31 CHAPTER 23 Weather and Climate 595