Page 12 - Focus TG4 KSSM (Physics) Terbitan Penerbitan Pelangi Sdn Bhd
P. 12

Physics  Form 4  Chapter 2 Force and Motion I

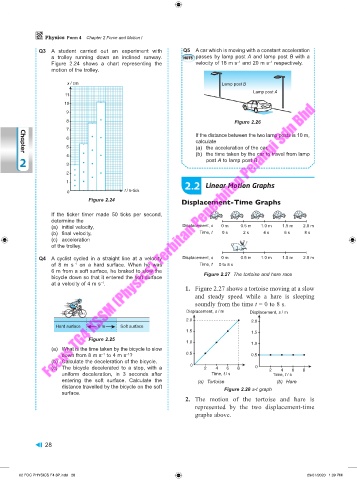
              Q3  A  student  carried  out  an  experiment  with                             Q5  A car which is moving with a constant acceleration
                  a  trolley  running  down  an  inclined  runway.             HOTS  passes by lamp post A and lamp post B with a
                                                                                         –1
                                                                              –1
                  Figure 2.24 shows a chart representing the     velocity of 18 m s  and 20 m s  respectively.
                  motion of the trolley.
                       x / cm                                            Lamp post B
                                                                                   Lamp post A
                      11
                      10
                       9
                       8                                                     Figure 2.26
                       7
                                                                 If the distance between the two lamp posts is 10 m,
                       6
                                                                 calculate
                       5                                         (a)  the acceleration of the car,
                                                                 (b)  the time taken by the car to travel from lamp
        Chapter
                       4
       2               3                                            post A to lamp post B.
                       2
                                                             2.2    Linear Motion Graphs
                       1
                       0                 t / 5-tick
                              Figure 2.24
                                                            Displacement-Time Graphs
                  If  the ticker timer made 50 ticks per second,
                  determine the
                  (a)  initial velocity,                    Displacement, s   0 m  0.5 m  1.0 m  1.5 m  2.0 m
                  (b)  final velocity,                            Time, t    0 s  2 s  4 s   6 s    8 s
                  (c)  acceleration
                  of the trolley.                                                Z Z Z

              Q4  A cyclist cycled in a straight  line at a velocity   Displacement, s   0 m  0.5 m  1.0 m  1.5 m  2.0 m
                  of 8 m s  on a hard  surface. When he was       Time, t      0 to 8 s
                         –1
                  6 m from a soft surface, he braked to slow the
                  bicycle down so that it entered the soft surface   Figure 2.27  The tortoise and hare race
                  at a velocity of 4 m s .
                                  –1
                                                              1.  Figure 2.27 shows a tortoise moving at a slow
                                                                and steady speed while a hare is sleeping
                                                                soundly from the time t = 0 to 8 s.
                                                              Displacement, s / m  Displacement, s / m
                                                              2.0
                                                                                   2.0
                   Hard surface  6 m    Soft surface
                                                              1.5                  1.5
                              Figure 2.25
                                                              1.0
                                                                                   1.0
                  (a)  What is the time taken by the bicycle to slow
                     down from 8 m s  to 4 m s ?              0.5                  0.5
                                  –1
                                          –1
                  (b)  Calculate the deceleration of the bicycle.
                  (c)  The bicycle decelerated  to a stop, with a   0  2  4  6  8   0    2  4   6  8
                     uniform deceleration, in 3  seconds  after       Time, t / s         Time, t / s
                     entering the soft surface. Calculate the      (a)  Tortoise           (b)  Hare
                     distance travelled by the bicycle on the soft        Figure 2.28 s-t graph
                     surface.
                                                              2.  The motion of the tortoise and hare is
                                                                represented by the two displacement-time
                                                                graphs above.


                28


       02 FOC PHYSICS F4 3P.indd   28                                                                29/01/2020   1:39 PM
   7   8   9   10   11   12   13   14   15   16   17