Page 13 - Focus TG4 KSSM (Physics) Terbitan Penerbitan Pelangi Sdn Bhd
P. 13

Physics  Form 4  Chapter 2 Force and Motion I
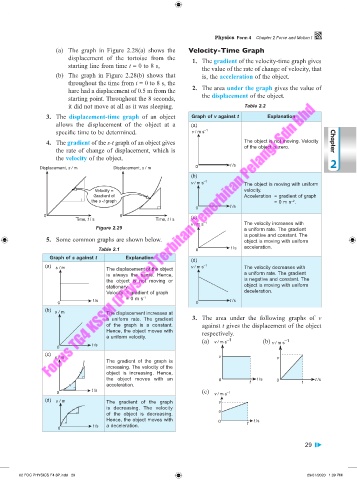
                   (a)  The  graph in Figure 2.28(a) shows the   Velocity-Time Graph
                       displacement of the tortoise from the     1.  The gradient of the velocity-time graph gives
                       starting line from time t = 0 to 8 s,       the value of the rate of change of velocity, that
                   (b)  The graph in Figure 2.28(b) shows  that    is, the acceleration of the object.
                       throughout the time from t = 0 to 8 s, the
                       hare had a displacement of 0.5 m from the     2.  The area under the graph gives the value of
                       starting point. Throughout the 8 seconds,   the displacement of the object.
                       it did not move at all as it was sleeping.               Table 2.2
                 3.  The  displacement-time graph of an object   Graph of v against t       Explanation
                   allows the displacement  of the object  at a   (a)
                   specific time to be determined.             v / m s –1
                 4.  The gradient of the s-t graph of an object gives           The object is not moving. Velocity   Chapter
                   the rate of change of displacement, which is                 of the object is zero.
                   the velocity of the object.

              Displacement, s / m     Displacement, s / m        0          t /s                            2
                                                               (b)
                                                               v / m s –1       The object is moving with uniform
                                Velocity =                                      velocity.
                               Gradient of                                      Acceleration  = gradient of graph
                                                                                                –2
                               the s -t graph                                             = 0 m s .
                                                                            t /s
                                                                 0
               0                        0                      (c)
                          Time, t / s               Time, t / s
                                                               v / m s –1       The velocity increases with
                                Figure 2.29                                     a uniform rate. The gradient
                                                                                is positive and constant. The
                 5.  Some common graphs are shown below.                        object is moving with uniform
                                 Table 2.1                       0          t /s  acceleration.
                 Graph of s against t     Explanation          (d)
                (a)                                            v / m s –1       The velocity decreases with
                   s / m            The displacement of the object
                                    is always  the same. Hence,                 a uniform rate. The gradient
                                    the object is not moving or                 is negative and constant. The
                                    stationary.                                 object is moving with uniform
                                    Velocity  = gradient of graph               deceleration.
                                          = 0 m s -1
                               t /s                                         t /s
                    0                                            0
                (b)
                   s / m            The displacement increases at
                                    a uniform rate.  The gradient     3.  The area under the following graphs of  v
                                    of the graph is a constant.    against t gives the displacement of the object
                                    Hence, the object moves with   respectively.
                                    a uniform velocity.
                                                                   (a)  v / m s –1     (b)  v / m s –1
                               t /s
                    0
                (c)
                   s / m                                                v                  v
                                    The gradient  of the graph  is
                                    increasing. The velocity of the
                                    object is increasing. Hence,
                                    the object moves with an            0           t /s   0           t /s
                                    acceleration.                                 t                t
                               t /s                                (c)
                    0                                                  v / m s –1
                (d)  s / m          The gradient of the graph           v
                                    is  decreasing.  The  velocity
                                    of the object is decreasing.        u
                                    Hence, the object moves with        0          t /s
                               t /s  a deceleration.                             t
                    0
                                                                                                    29


       02 FOC PHYSICS F4 3P.indd   29                                                                29/01/2020   1:39 PM
   8   9   10   11   12   13   14   15   16   17   18